Kibana
Introduction
As WaveMaker is a distributed application, each microservice generates its logs in its own container. These logs are very important to analyze or fix any issue in the Platform.
Traditionally, you should to do the following to access the log statements.
- Obtain remote server access.
- Know the required details to connect to the server
- Access the container
- Open the application logs file using a CLI text editor
- Search for the required log statements using the basic string search provided by the CLI text editor.
It gets more and more difficult if the logs are supposed to be shared with someone else or if you want to check the logs which have been generated a couple of days ago.
Kibana solves all these problems by making the logs easily accessible. One can also easily share the logs across the team with a single URL. The logs are also secure as they can only be accessed by authenticated users.
For more information, see Kibana's Opensource repository.
Kibana is purely used for the logs generated by the Platform. Application logs generated by the apps developed in WaveMaker are never pushed to Kibana.
How to access Kibana
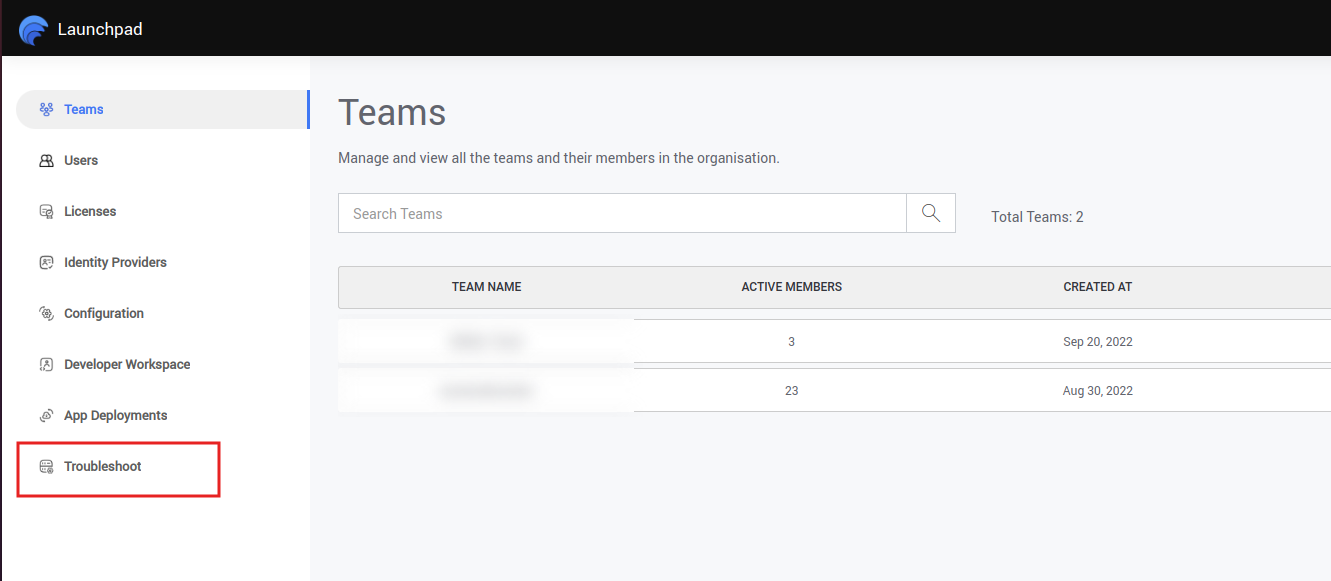
- Once you login to WaveMaker, open Launchpad and click Troubleshoot located on the bottom left as shown below.
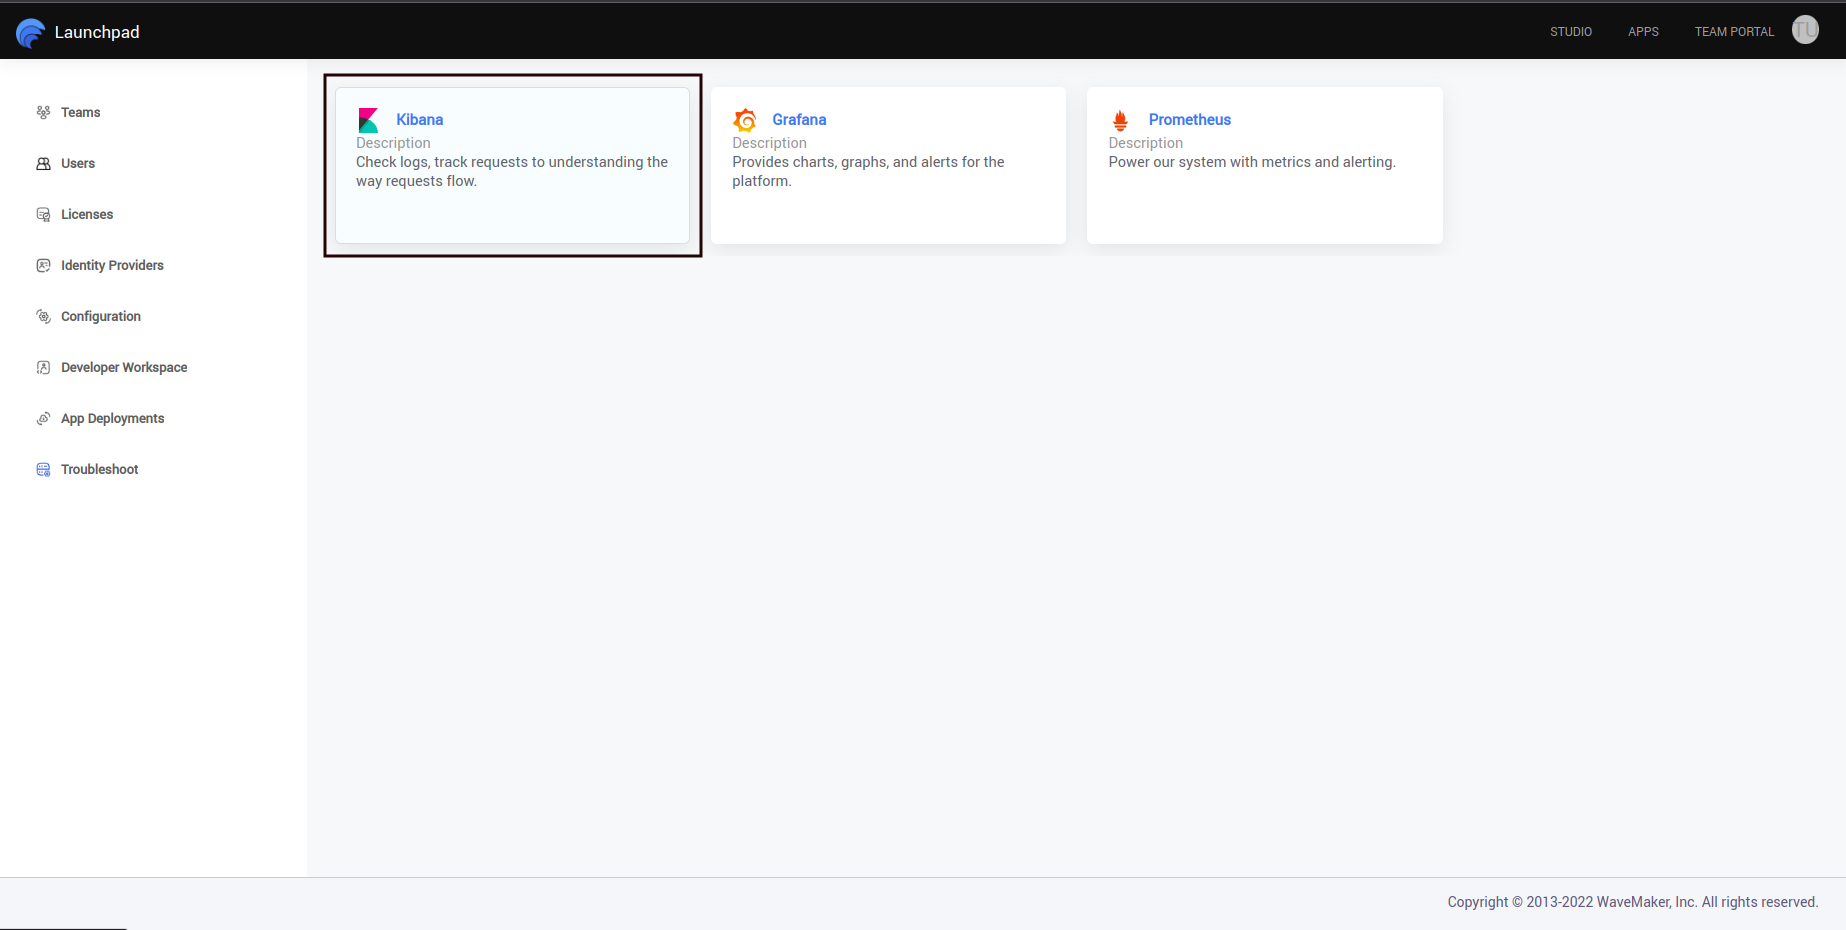
- From the Troubleshoot menu, click "Kibana", as shown below.
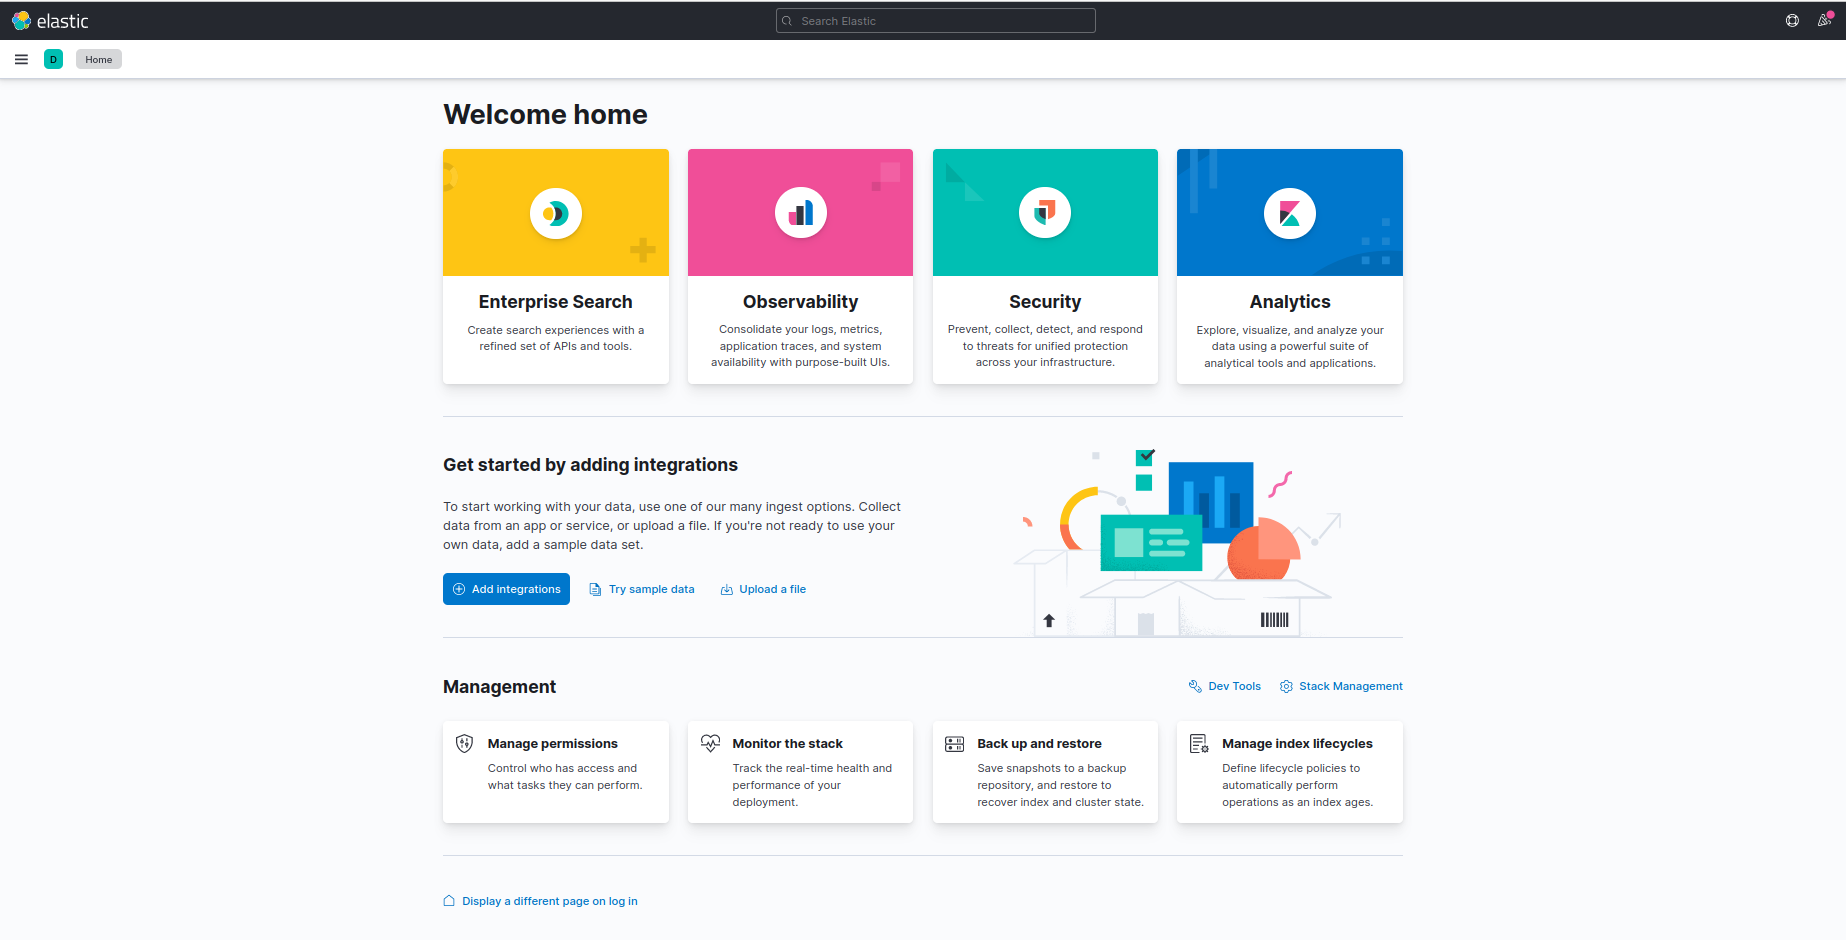
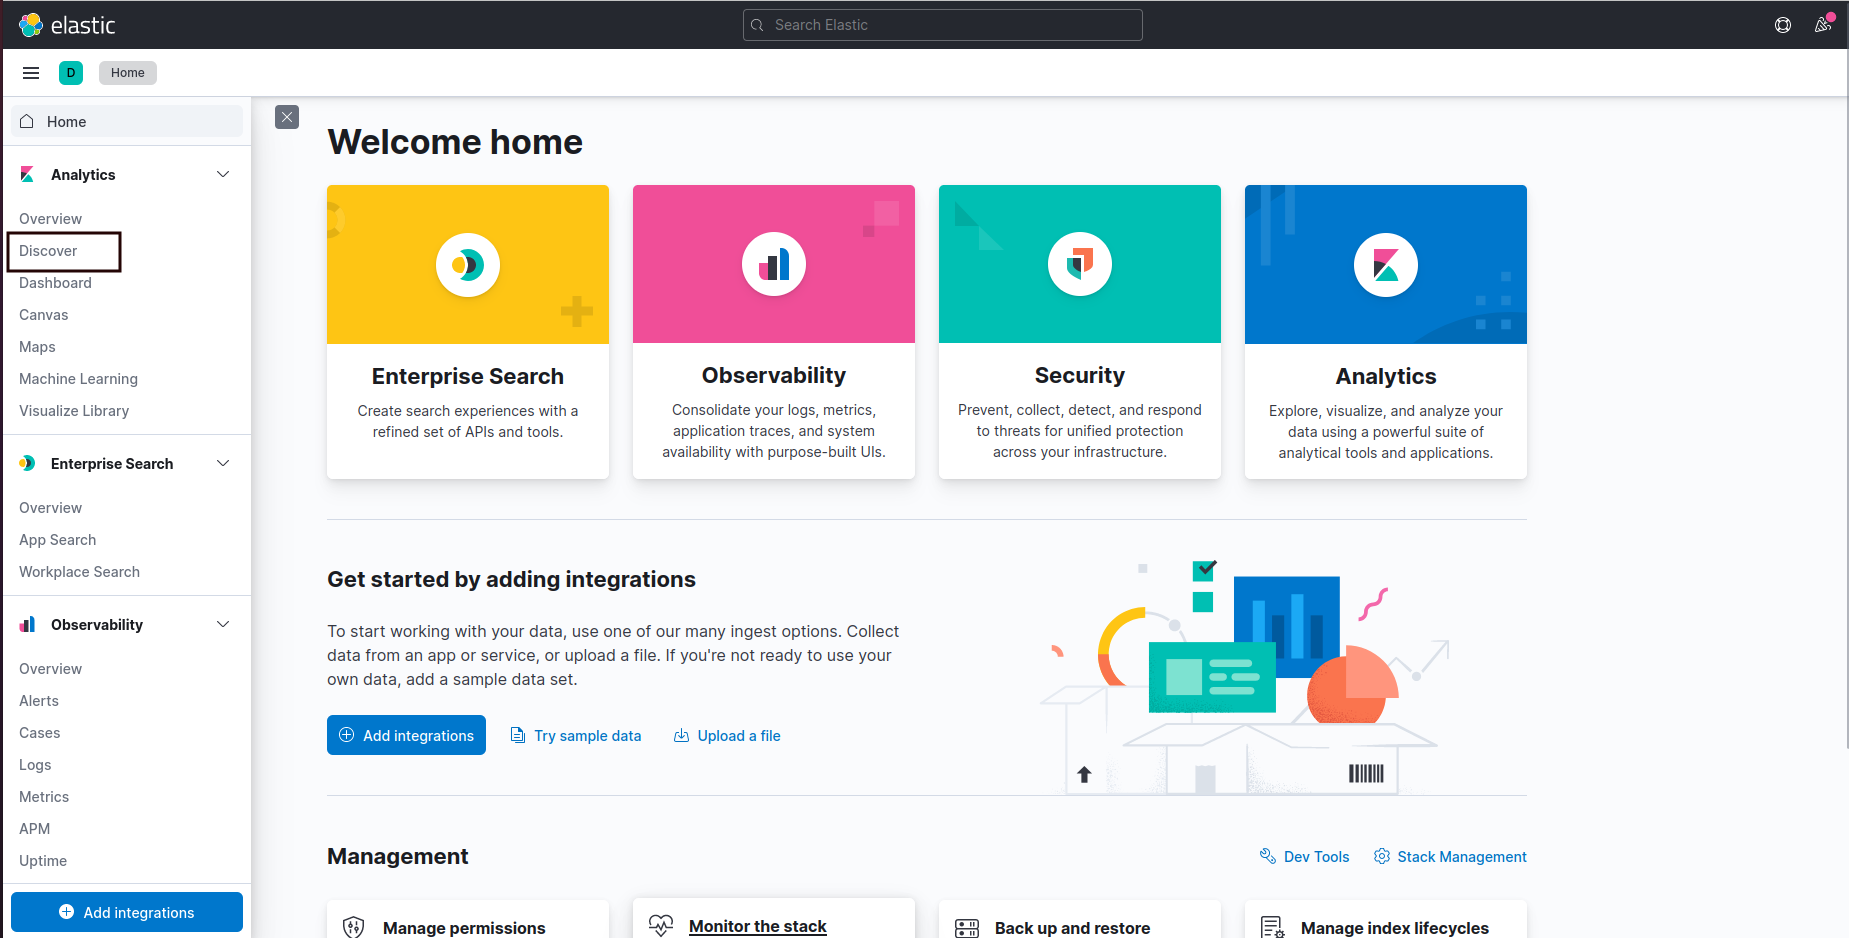
- It opens the Kibana home page. The home page should look like the below image.
- To search for logs using Kibana, go to "Discover" located in the left navigation bar.
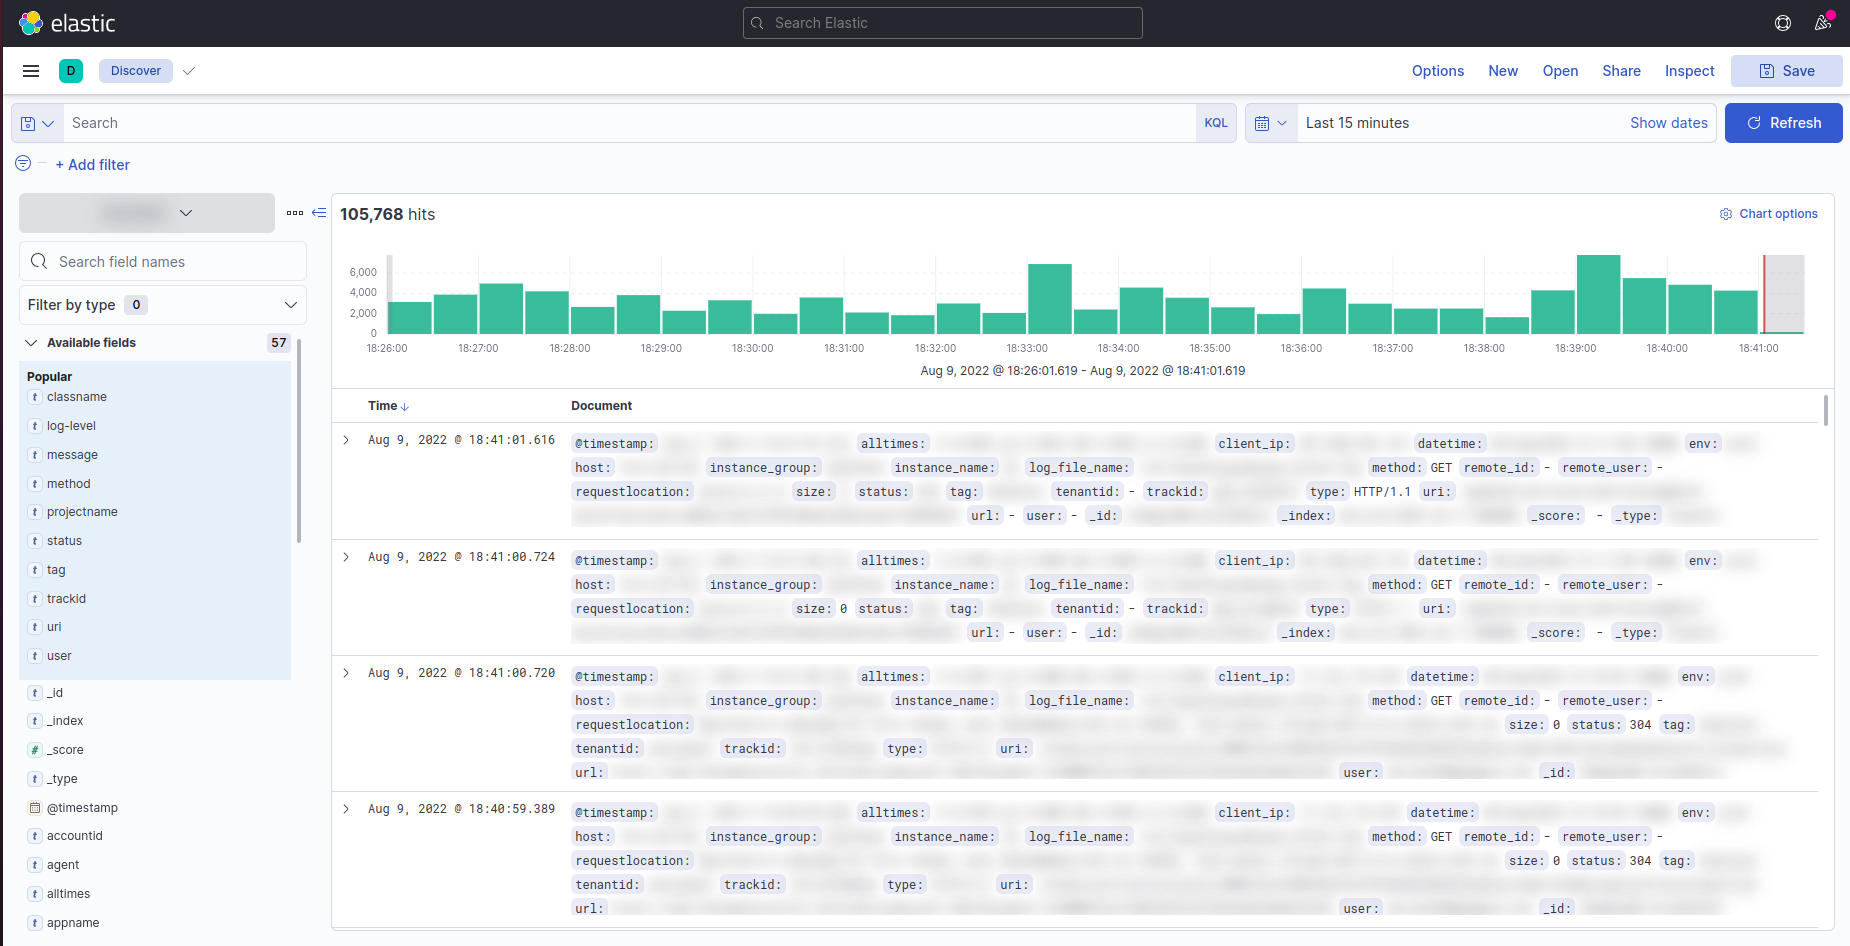
- Finally, you should see the following screen.
Use Case 1
Accessing specific Microservice log (Container-Services) from Kibana.
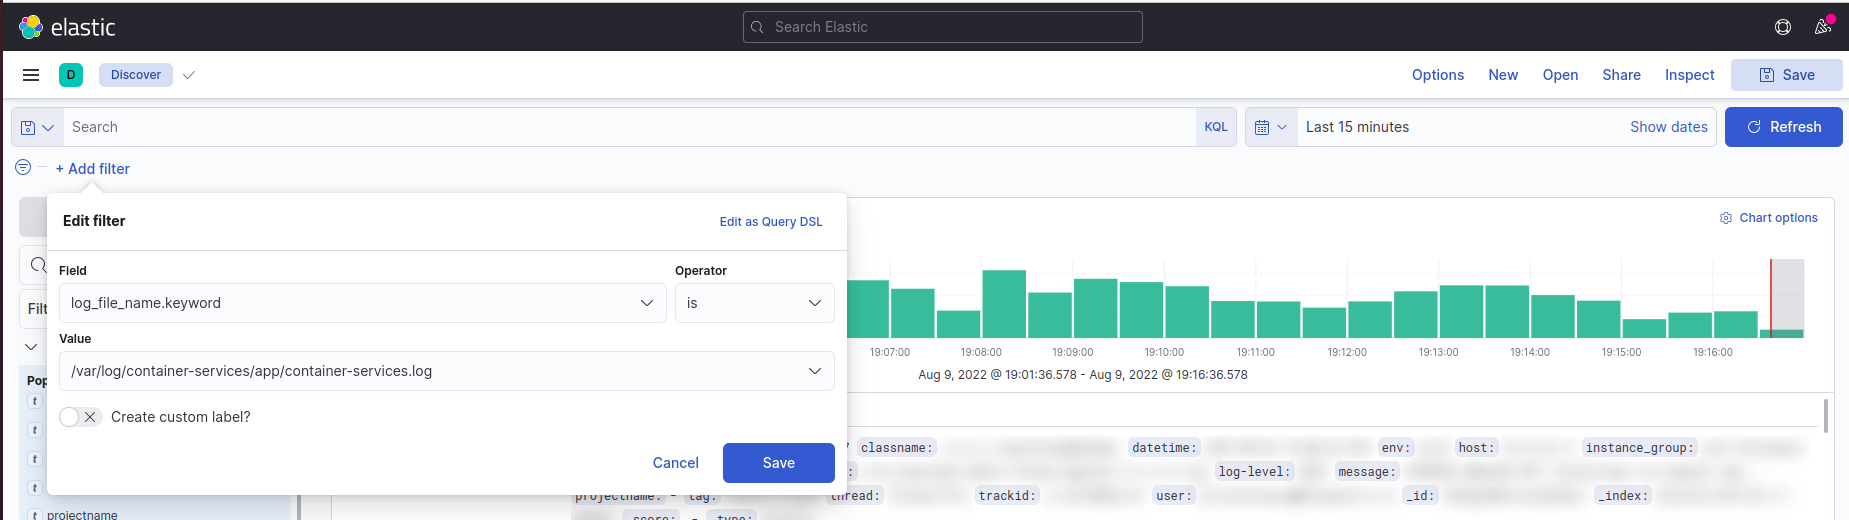
- Select Discover from the Kibana and add the Filter by selecting log_file_name.keyword as container-services.
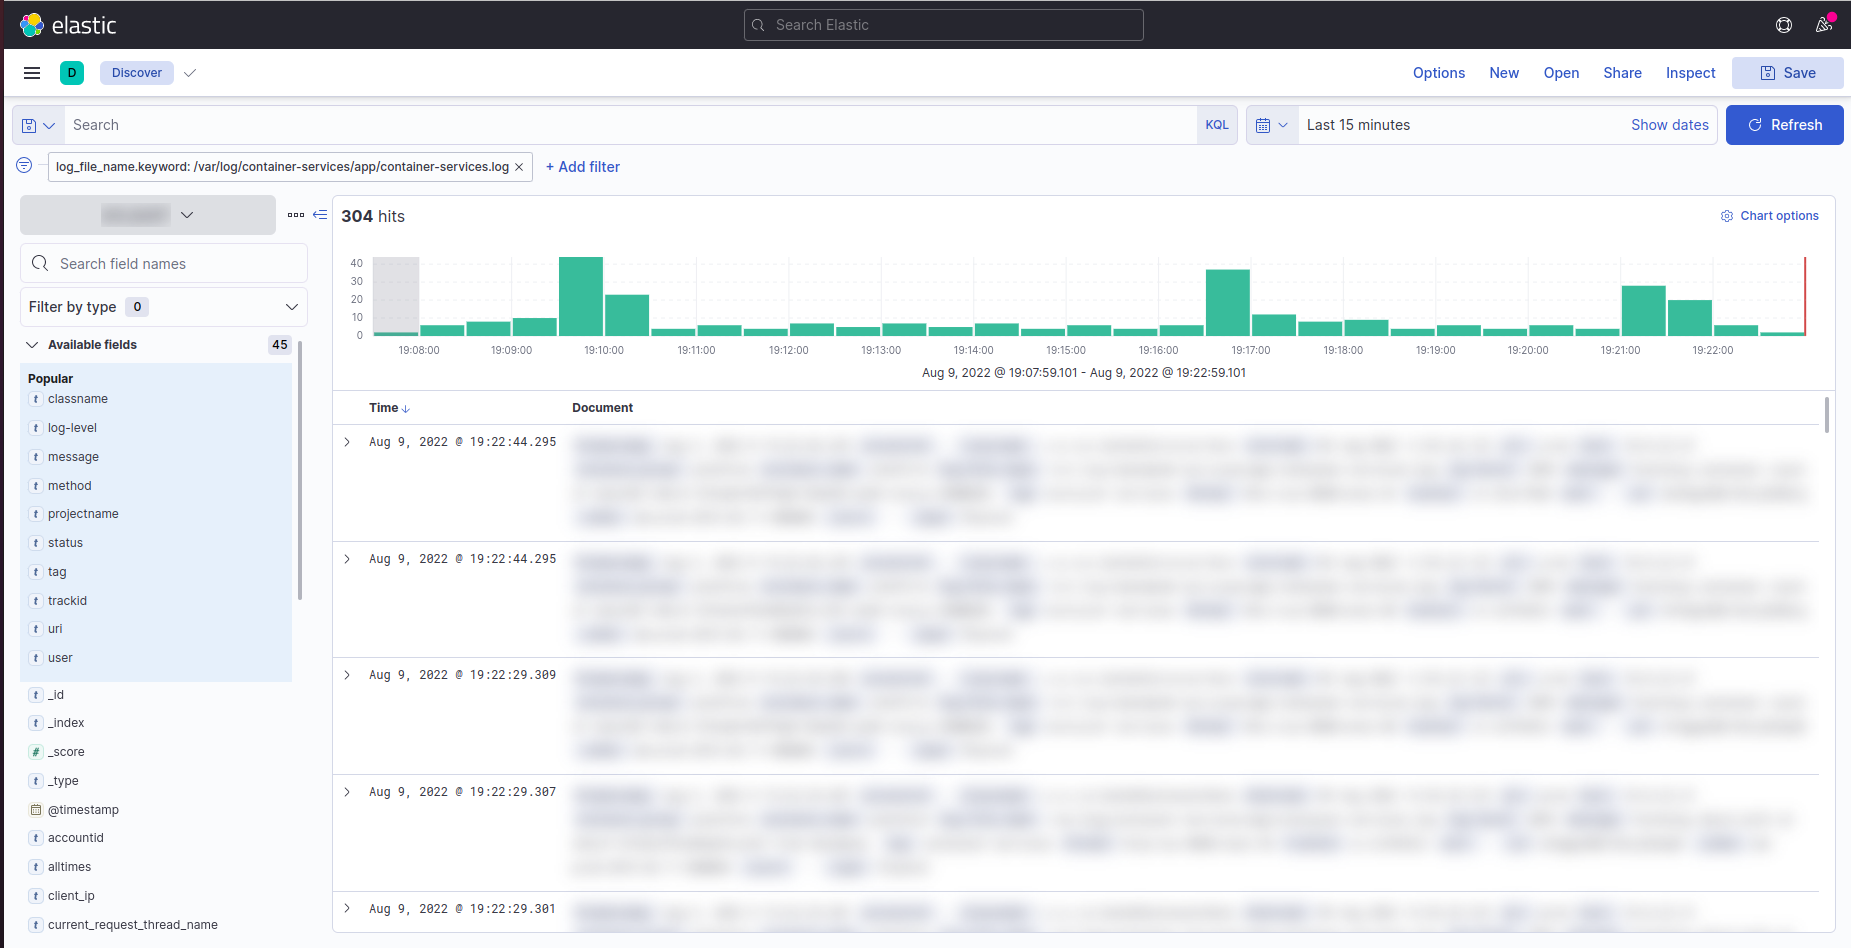
- Below screenshot displays the searched filter results of edn-services.
Use Case 2
Accessing all Microservices log from the Kibana dashboard.
- From Kibana, click Dashboard and Select MicroServiceLogs which is a predefined dashboard in Kibana.
- Below screenshot displays logs of all the available microservices.

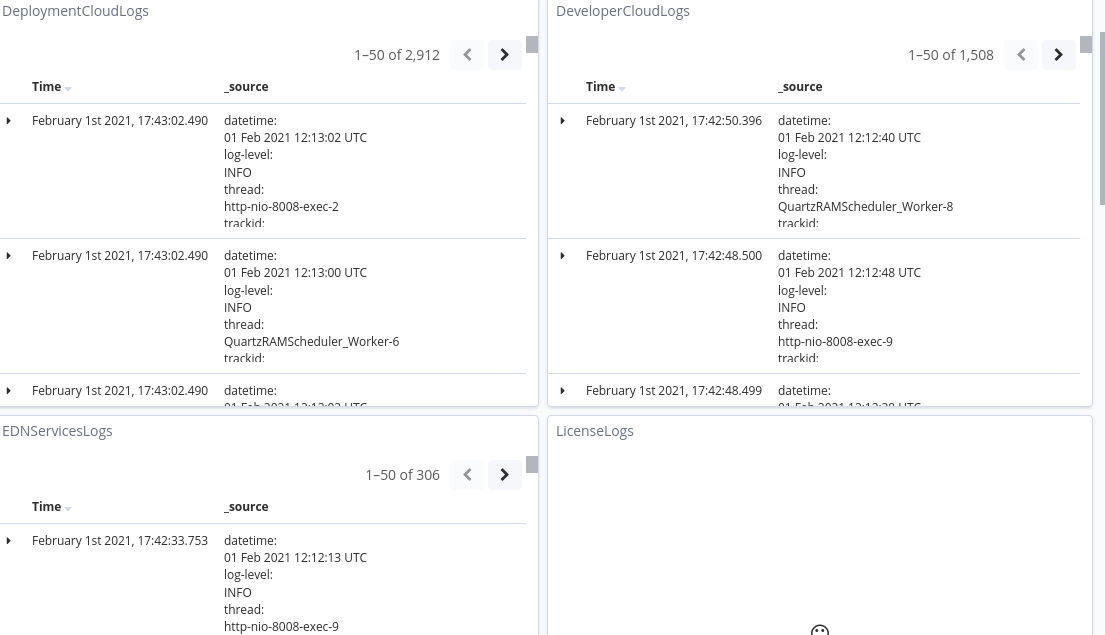
Data is pixelated for privacy reasons.
The Discover page is where you will be able to filter through all the logs.
Kibana Filters
The required logs can be searched by applying appropriate filters. The below tables list out the most frequently used filters.
Application log filters
| Filter | Description | Example Value |
|---|---|---|
user.keyword | Get the logs printed in the user context by using the user login ID | user1@my-wme.com |
classname.keyword | The log statements printed by a java class | o.s.w.c.RestTemplate ( here, the fully qualified name is of the java class is *org.springframework.web.client.RestTemplate* ) |
host.keyword | The local IP of the machine from which the logs are collected | 10.0.22.135 |
log-level.keyword | The log level used for printing the log statement | INFO, DEBUG, WARN, ERROR |
message.keyword | The actual log statement | can be any string |
tag.keyword | The Platform microservice name | remote-studio, jobs-service , jobs-worker, etc |
thread.keyword | The logs belonging to a particular java thread id | http-nio-8008-exec-3 |
Similarly, Access logs are also pushed to Elastic Search. They can be also be filtered using the below filters.
Access log filters
| Filter | Description | Example Value |
|---|---|---|
reqmethod.keyword | The request method of access logs | GET, PUT, etc. |
type.keyword | HTTP request Type | HTTP/1.1 |
uri.keyword | The URI of the backend API call | /index.html |
url.keyword | The URL of the backend API call | https://www.my-wme.com/studio/ |
client_ip.keyword | The IP of the client who made the API call | 127.127.127.127 |
The .keyword suffix mentioned in all the above filters is optional. Adding it will just help in auto-suggestion.
Apart from the filters mentioned above, Kibana supports many more filters, however, the above-specified filters should be suitable in most cases.
How to Apply Filters
Now that we know the filters which can be applied, let us check how to apply filters in the below example.
Let's say we want to filter the message of the INFO log statements from all the log statements generated by the platform.
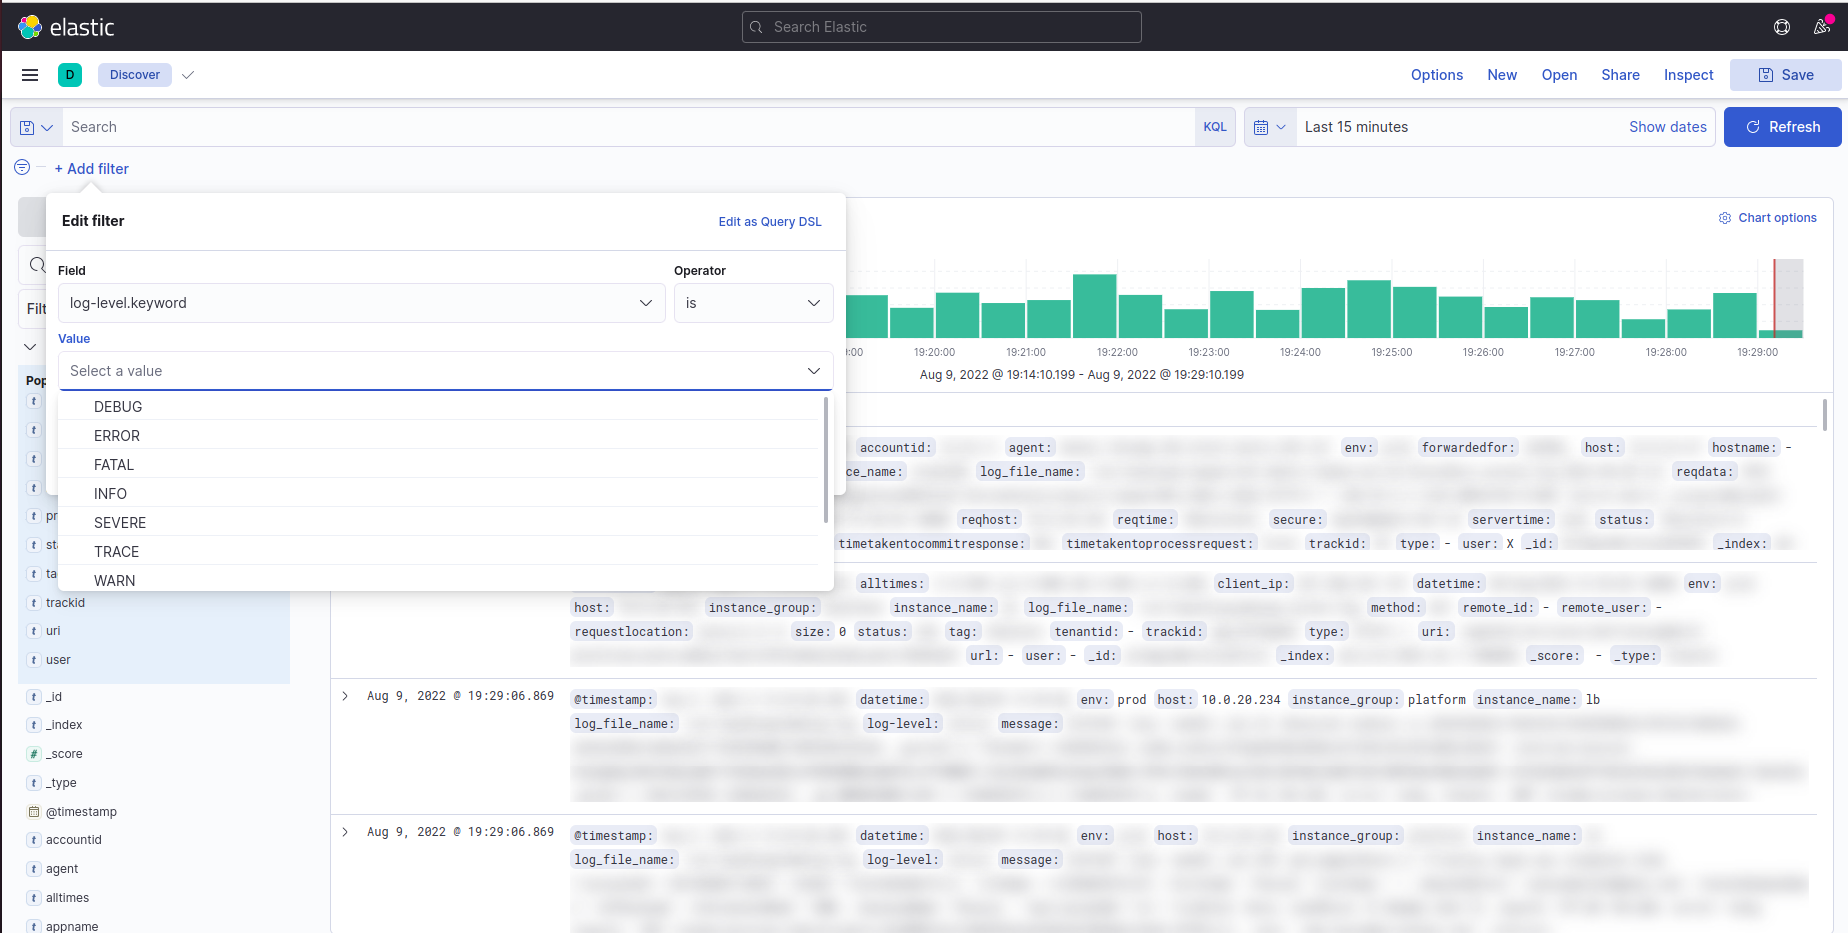
- In the Kibana's Discover page, click the "Add a filter" button on the top left.
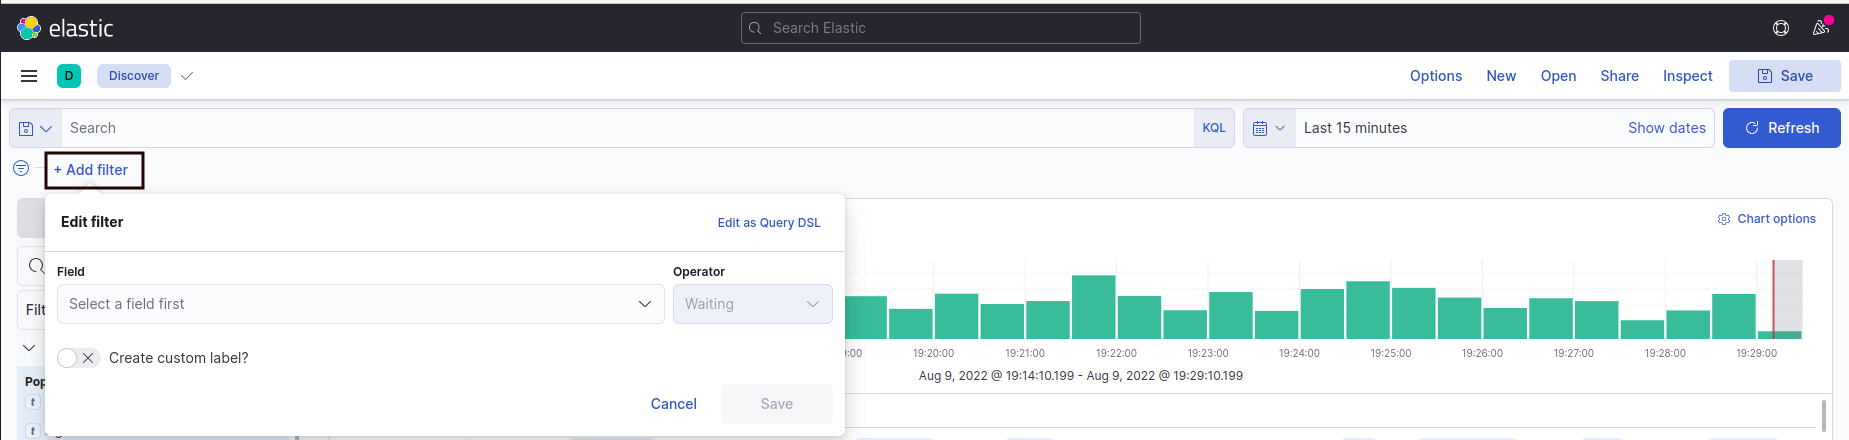
- Use
log-level.keywordas the filter type.
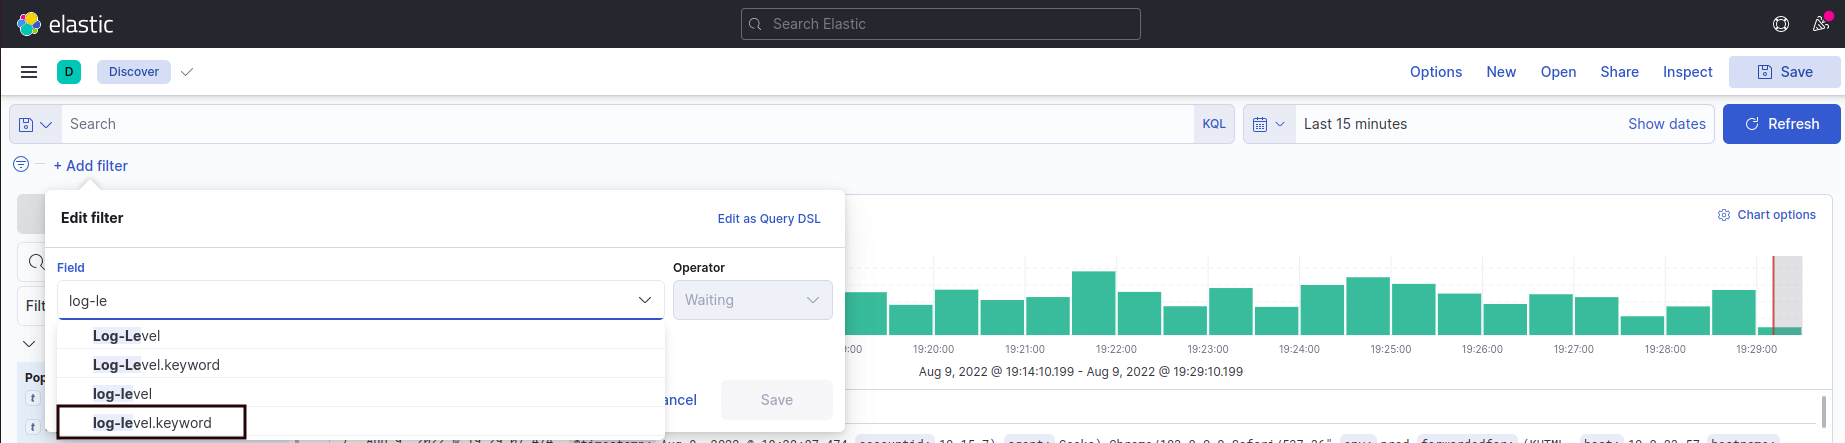
- Select
isas the operation.
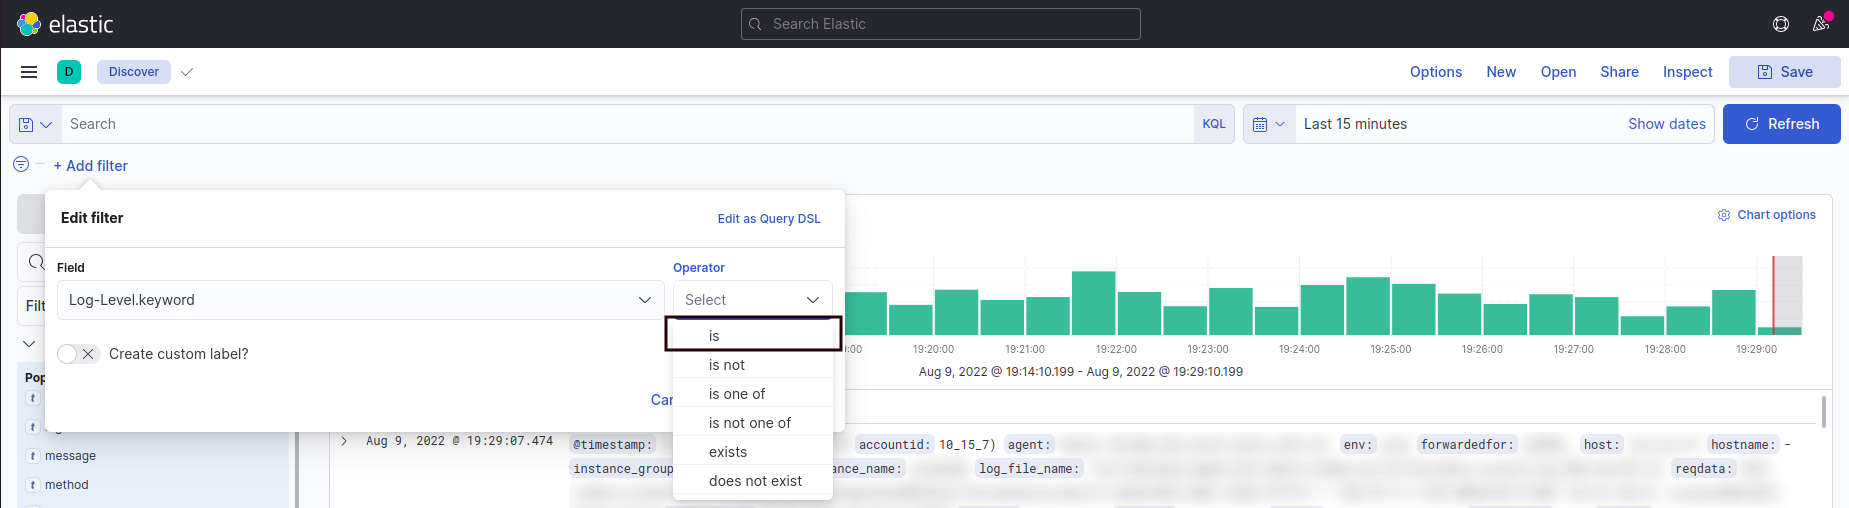
- Type
INFOin the value field.
That's all.
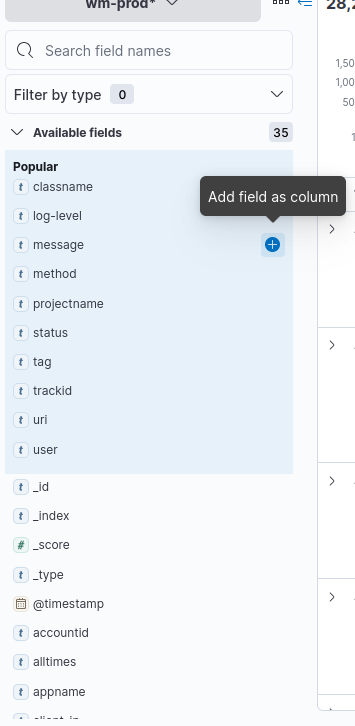
But, as we want to check the messages, we can add that as a field by doing the following.
5) Click the "add" button beside the "message" label as shown in the below image.
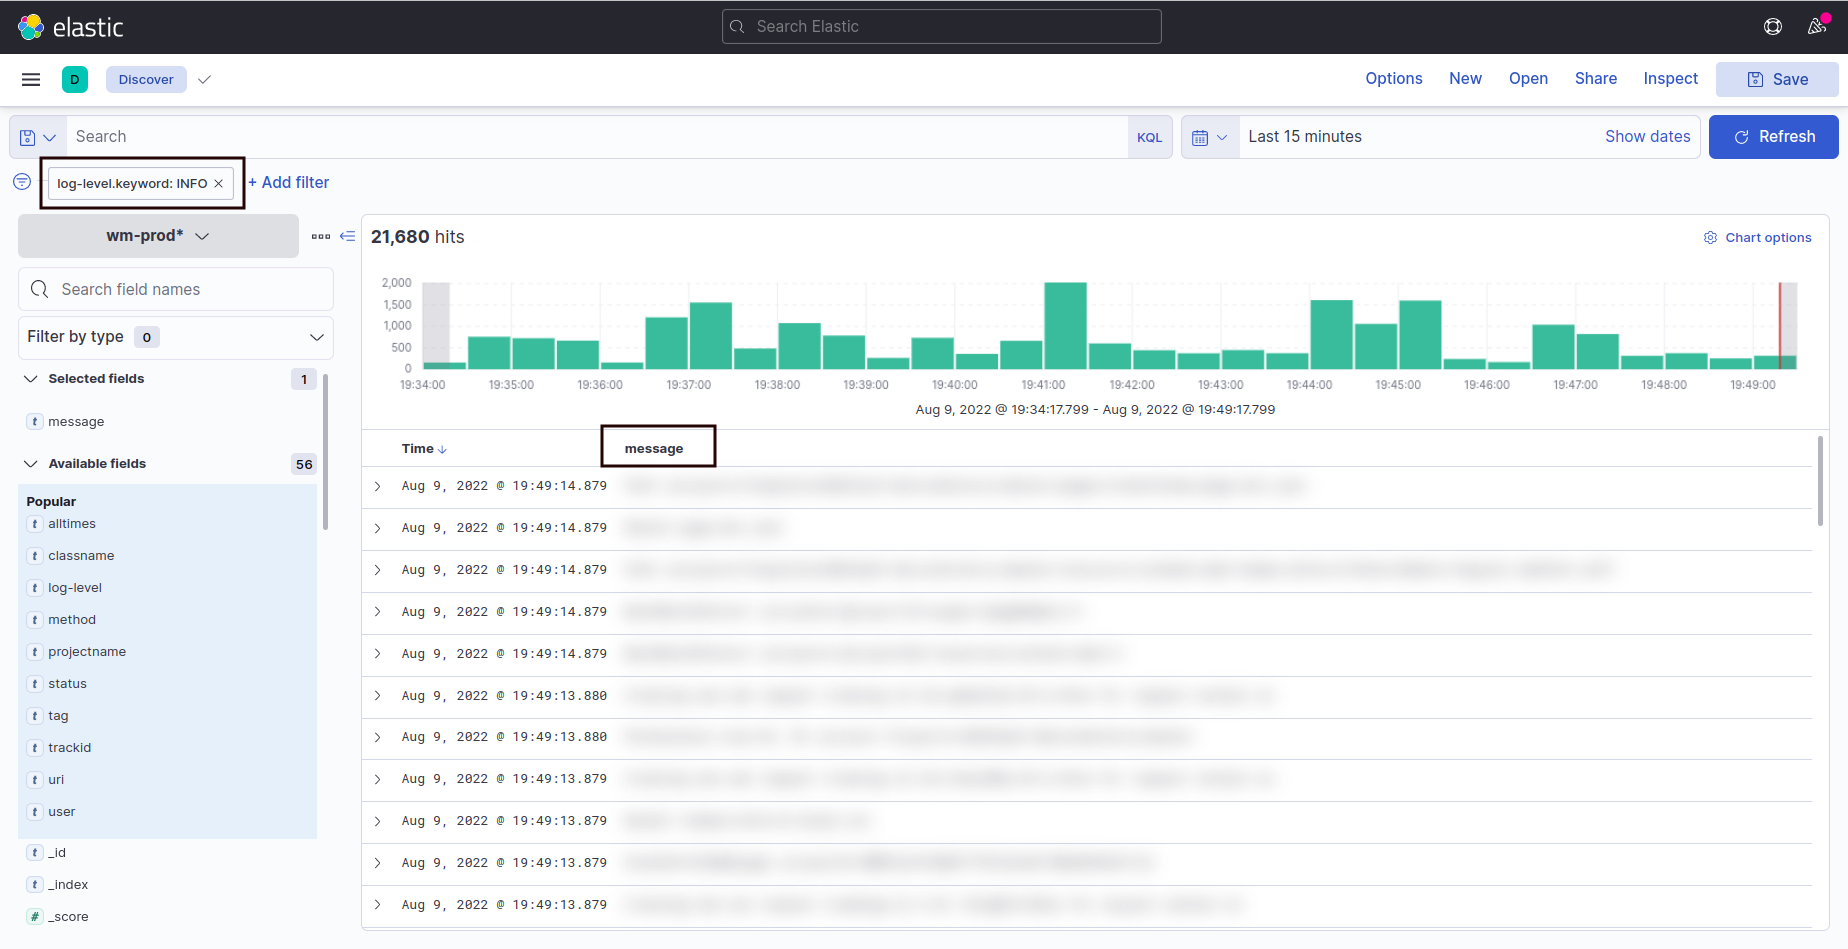
6) Finally, this is what it should look like.
Some Common Use Cases
- Accessing Specific MicroService logs from Kibana.
Select Discover from the Kibana and add the Filter by selecting tag.keyword. A drop down with the list of microservices will display. Select the microservice ex:lbaccess log and save to apply the filter.
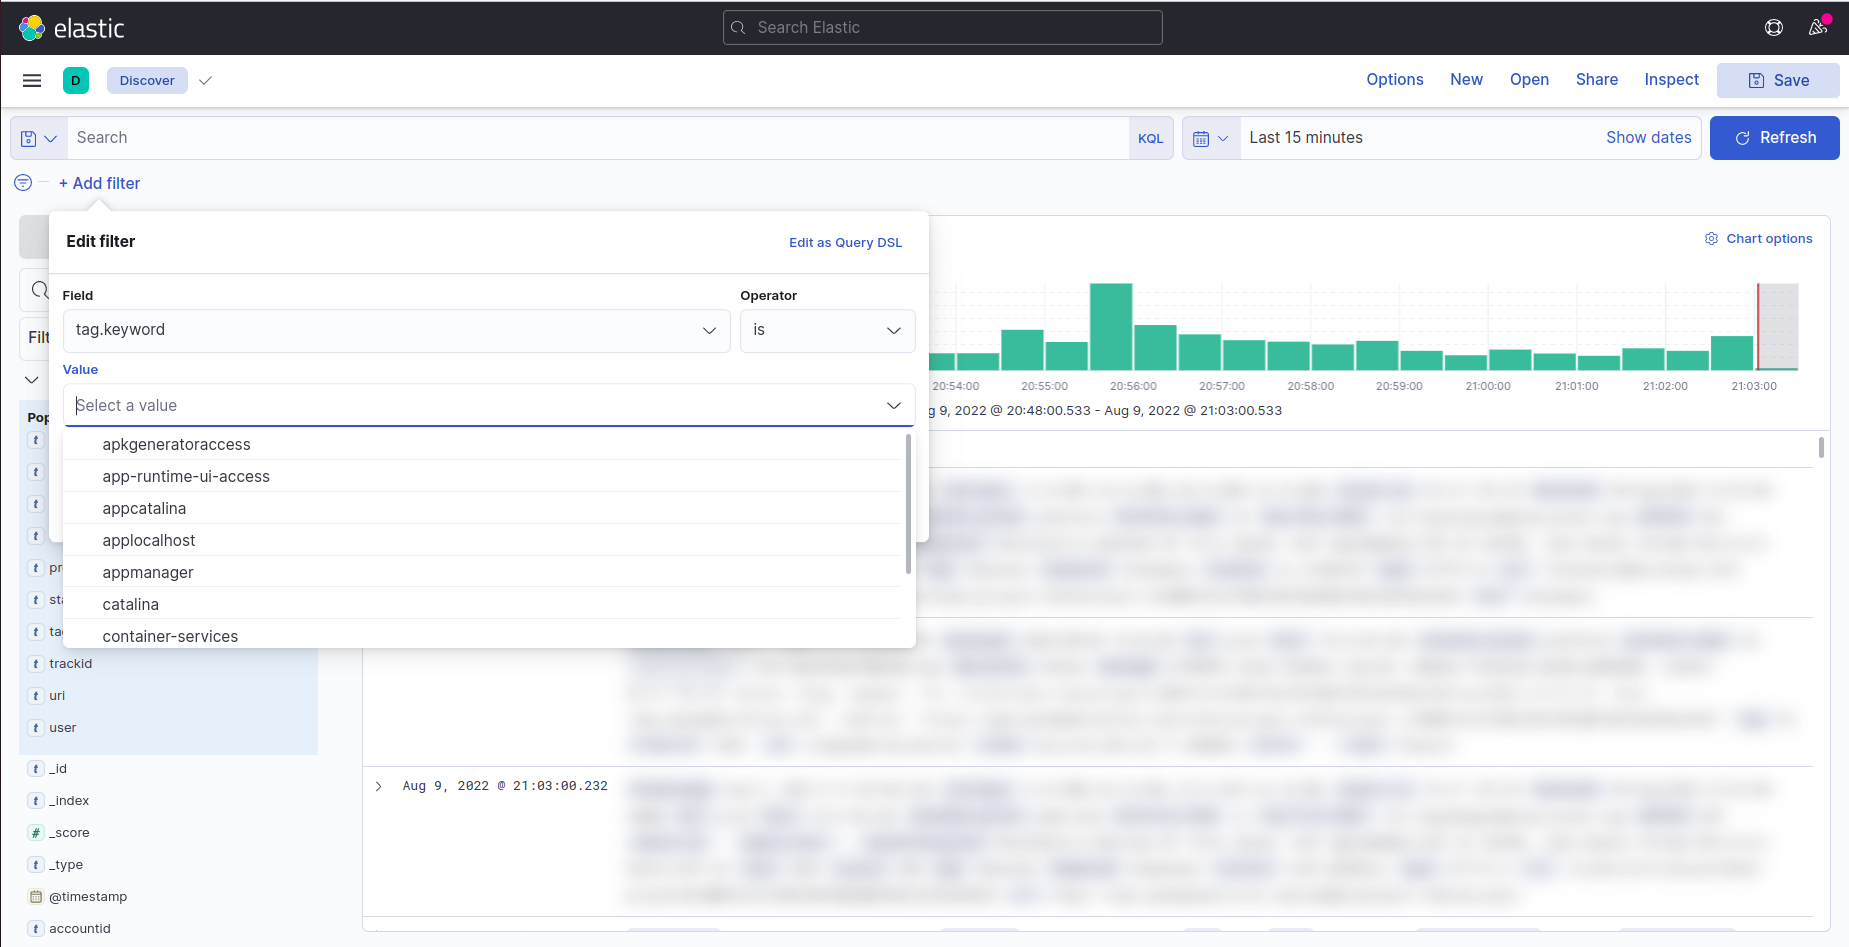
Below screenshot displays the searched filter results of lbaccess log.
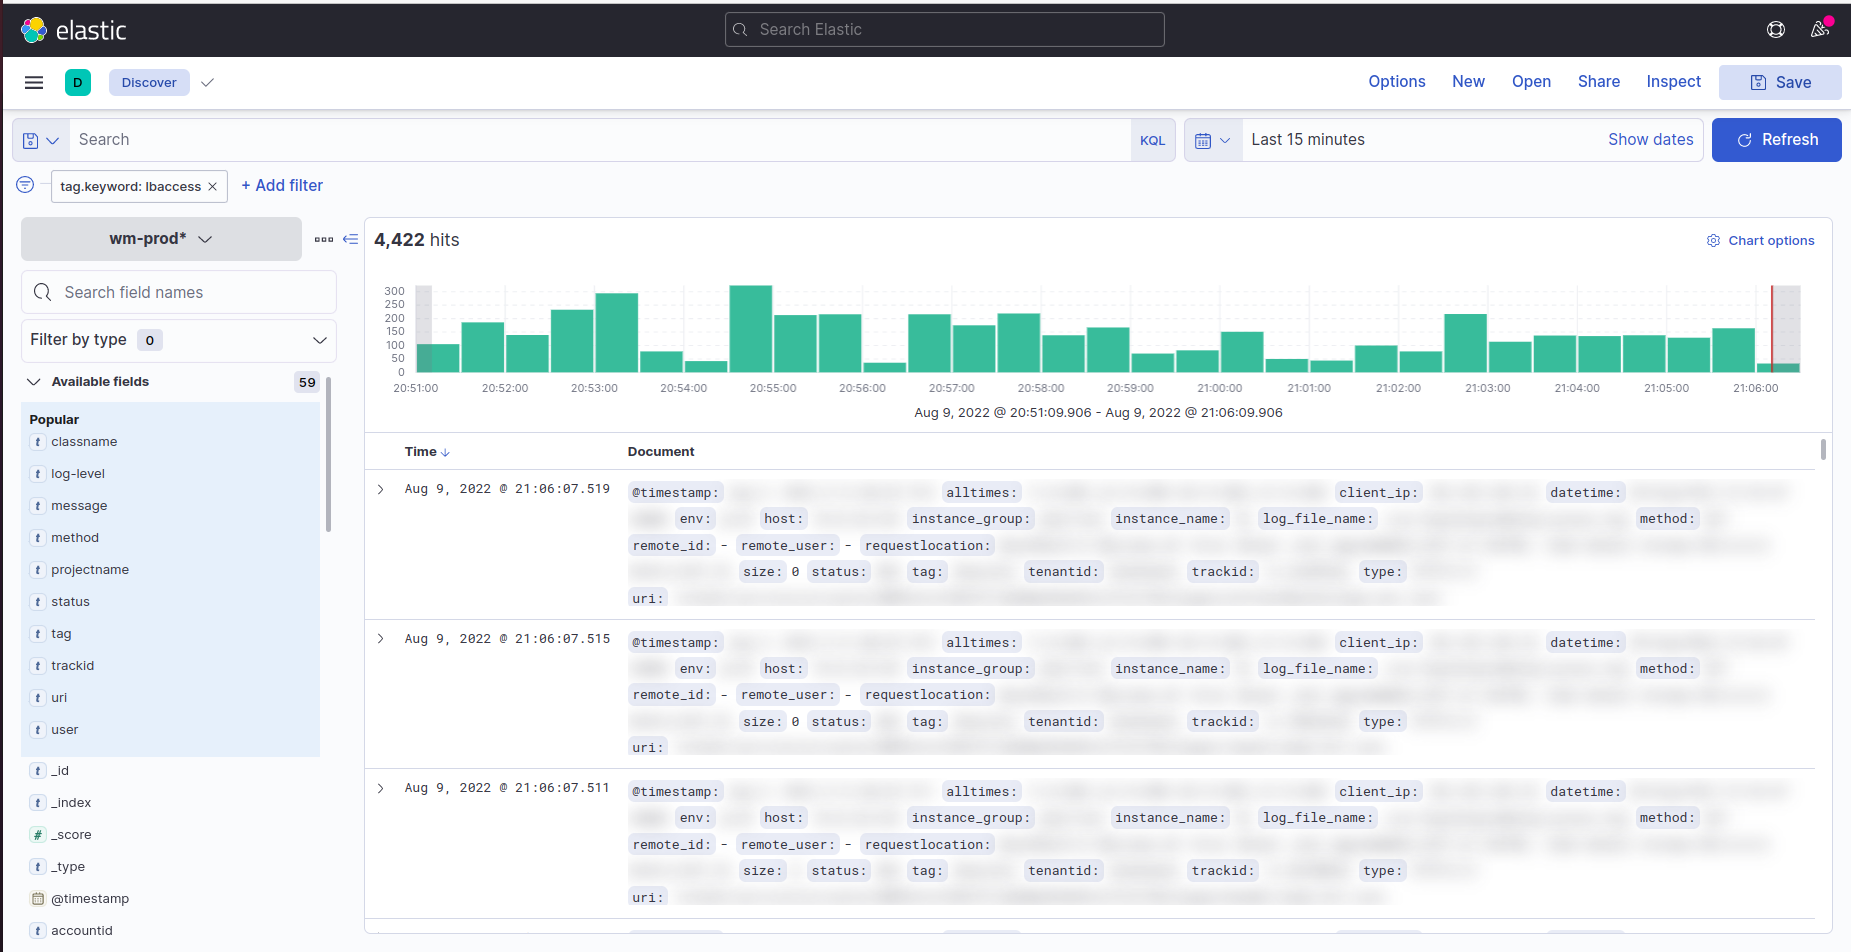
Similarly, Filter can be applied to other services, such as Login, EDN-Services, Developer-Cloud, Studio, Launchpad, and more.


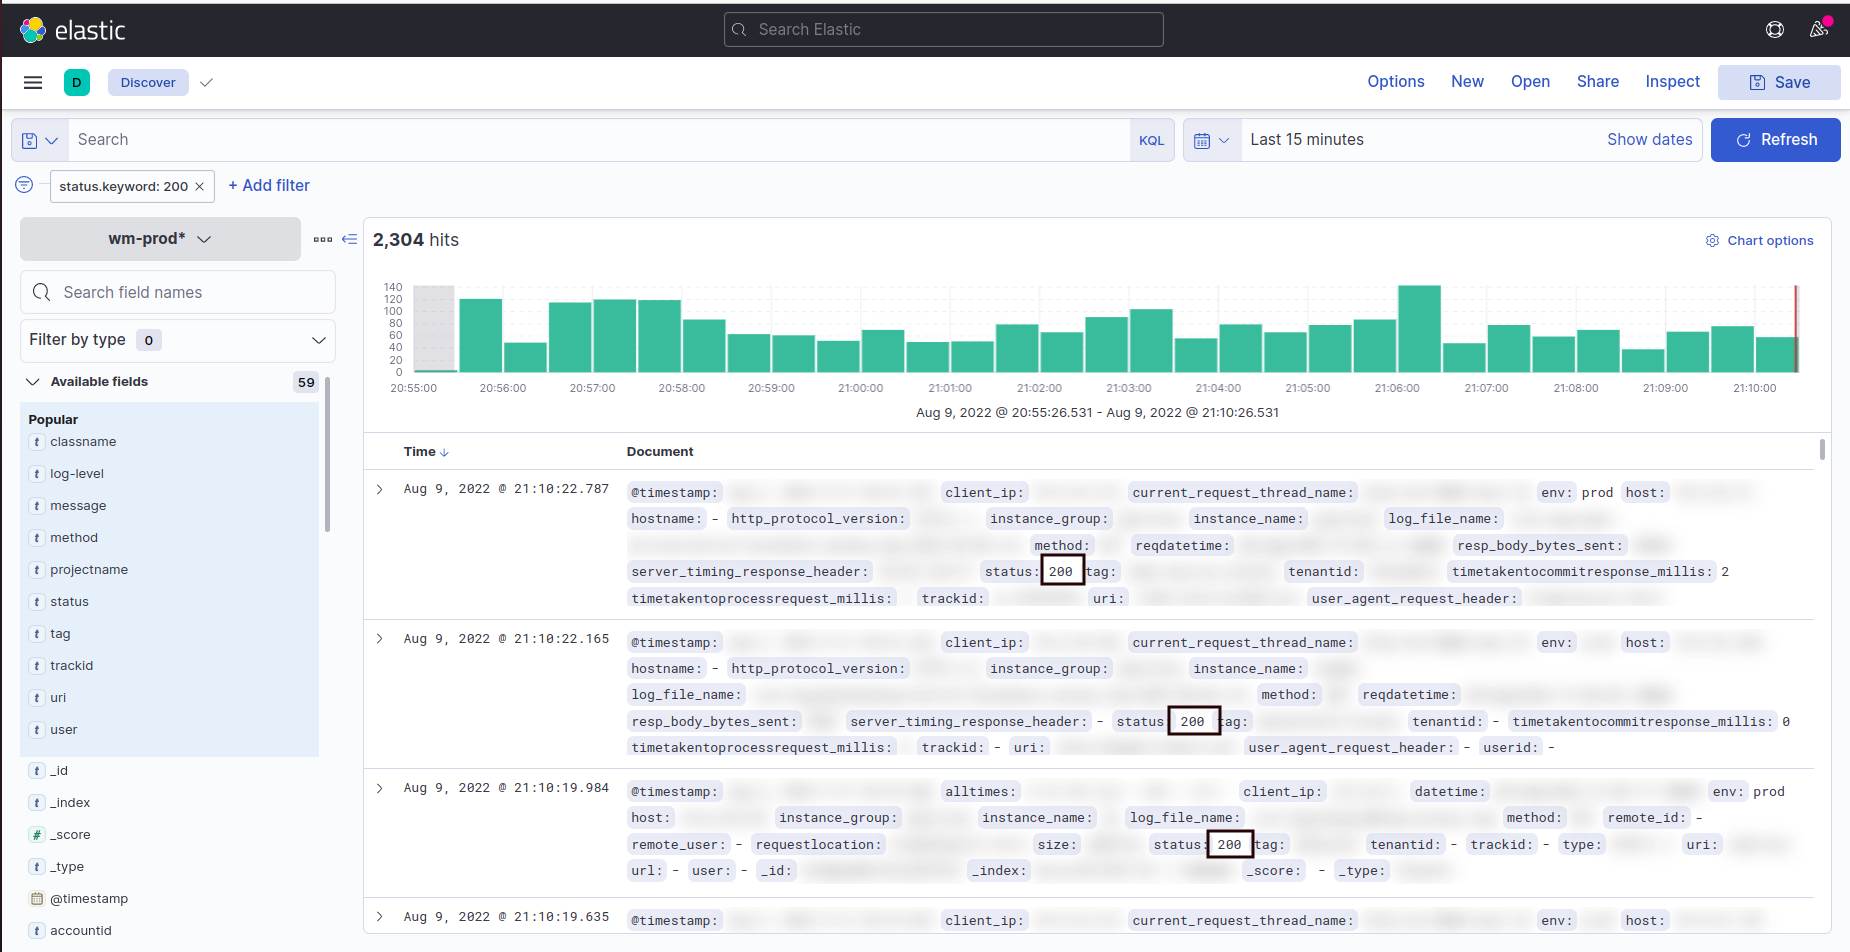
- Fetching logs based on the Status Code.
Select Discover from the Kibana and apply the Filter by selecting status.keyword. A drop down with the list of status codes will display. Select the status code and save to apply the filter. The below screenshot displays the searched filter results of status code 200.