Mobile App Performance Metrics
Performance Metrics
A performance metric is a measurable value that indicates the efficiency, effectiveness, quality, or performance of a process, system, or product. In the context of mobile applications, performance metrics help developers and managers understand how well the application is functioning and where improvements might be needed.
Considering multiple metrics in performance measurement is pivotal to obtaining a holistic view of an application or system’s efficacy. Single metrics can offer a skewed perspective, potentially overlooking critical issues or opportunities for enhancement. By employing a diverse array of metrics, organizations ensure that all facets - from user experience and system reliability to resource utilization and financial impact - are meticulously assessed. This multifaceted approach not only safeguards against performance blind spots but also fortifies decision-making, ensuring that strategies are formulated upon a comprehensive, nuanced understanding of performance dynamics.
We have identified categorized few important metrics that are essential for measuring the performance of a mobile application. The following are the categories of performance metrics:
- React Native JS
- Bridge
- Native
- Device
and here the list of metrics under each category:

Let's see more about each metric with their Baseline values for reference.
JS Frame Rate (Javascript Thread)
Category:
React Native JS
What:
This metric measures the time taken by a JS thread to execute the code and in Android Navigator uses this thread.
Baseline:
- Ideal - 60 FPS (frames per second)
- Reasonable - 30 FPS
- Less than 30 FPS (Sluggish app)
Navigation Render Time (UI Screen Transition Speeds)
Category:
React Native JS
What:
- Timer starts when some
Touchableis pressed on screen A - The app navigates to screen B
- The timer is stopped when the screen B is mounted and is fully rendered
Baseline:
- Simple apps - under 0.3 sec (300 ms)
- Moderate apps - 0.3 sec to 1 sec
- Complex apps - under 1 sec
Screen re-render Time
Category:
React Native JS
What:
- Timer starts when a certain UI event occurs on a screen (say pull-to-refresh)
- Stuff happens on the screen (e.g., network calls)
- The timer is stopped when the screen is fully rendered again
Baseline:
- Standard - 60 FPS (frames per second)
- Higher - 90 & 120
- Lower - 30 FPS
Javascript Bundle Size
Category:
React Native JS
What:
The size of your JavaScript bundle and it can impact app load times and performance.
Baseline:
- Small to Medium sized apps: 4-6 MB or less
- Large & Complex apps: 6-10 MB or less
UI Frame Rate (Main Thread)
Category:
Bridge
What:
This metric calculates the time taken to measure layout/draw the UI and NavigatorIOS uses this thread so it is better than Navigator (used in Android).
Baseline:
- Ideal - 60 FPS (frames per second)
- Reasonable - 30 FPS
- Less than 30 FPS (Sluggish app)
Stutters (Jank)
Category:
Native
What:
If the JavaScript thread is locked up, the animation stutters.
Baseline: 0 Stutters
Frame Drop
Category:
Native
What:
Delay in rendering screens (not 60 fps).
Baseline: 0 Frame Drops
Slow Frame
Category:
Native
What:
If app takes more than 16.67 ms for a frame.
Baseline: 0 Slow Frames
Frozen Frame
Category:
Native
What:
UI frames that take longer than 700 ms.
Baseline: 0 Frozen Frames
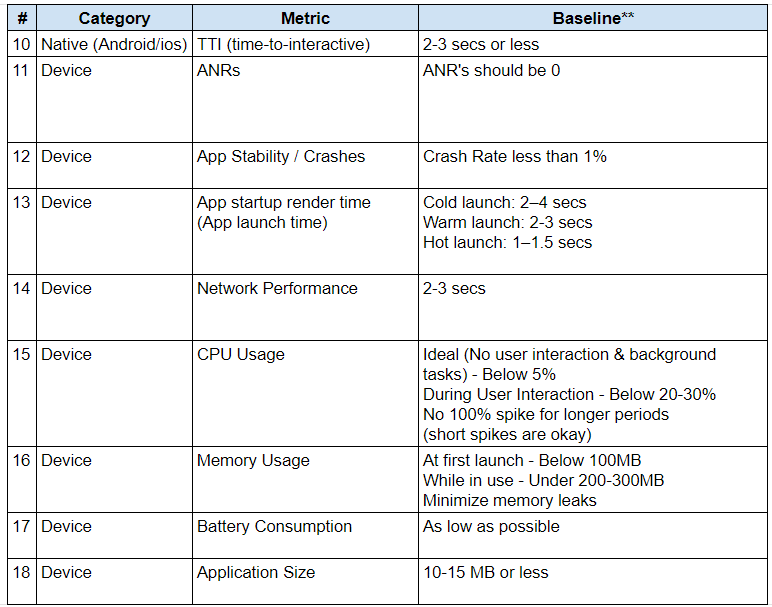
TTI (time-to-interactive)
Category:
Native
What:
Time till screen/component gets interactive.
Baseline: 2-3 secs or less
App Stability / Crashes
Category:
Device
What:
App stability is measured in crashes per session or user.
Baseline: Crash Rate less than 1%
ANRs (Application Not Responding)
Category:
Device
What:
"Application Not Responding" (ANR) error is triggered when the main thread of an app becomes unresponsive for an extended period typically around 5 seconds.
Baseline: ANR's should be 0
Network Performance
Category:
Device
What:
Network performance refers to measures of service quality of a network as seen by the customer.
Baseline: 2-3 secs
App startup render time (App Launch Time)
Category:
Device
What:
- The timer starts when the native portion of the app is started
- The timer is stopped when the first screen in the app is mounted and fully rendered
Baseline:
- Cold launch: 2–4 secs
- Warm launch: 2-3 secs
- Hot launch: 1–1.5 secs
CPU Usage
Category:
Device
What:
CPU utilization indicates the amount of load handled by individual processor cores to run various programs.
Baseline:
- Ideal (No user interaction & background tasks) - Below 5%
- During User Interaction - Below 20-30%
- No 100% spike for longer periods (short spikes are okay)
Memory Usage
Category:
Device
What:
Memory utilization is the average utilization derived from the percent of available memory in use at a given moment.
Baseline:
- At first launch - Below 100MB
- While in use - Under 200-300MB
- Minimize memory leaks
Battery Consumption
Category:
Device
What:
How much power your apps and system software use.
Baseline: As low as possible (Should not drain the battery while app in-use)
Application Size
Category:
Device
What:
Refers to the amount of space an application takes up on a device's storage.
Baseline: 10-15 MB or less