Google Chrome Extension: WaveMaker Devtool
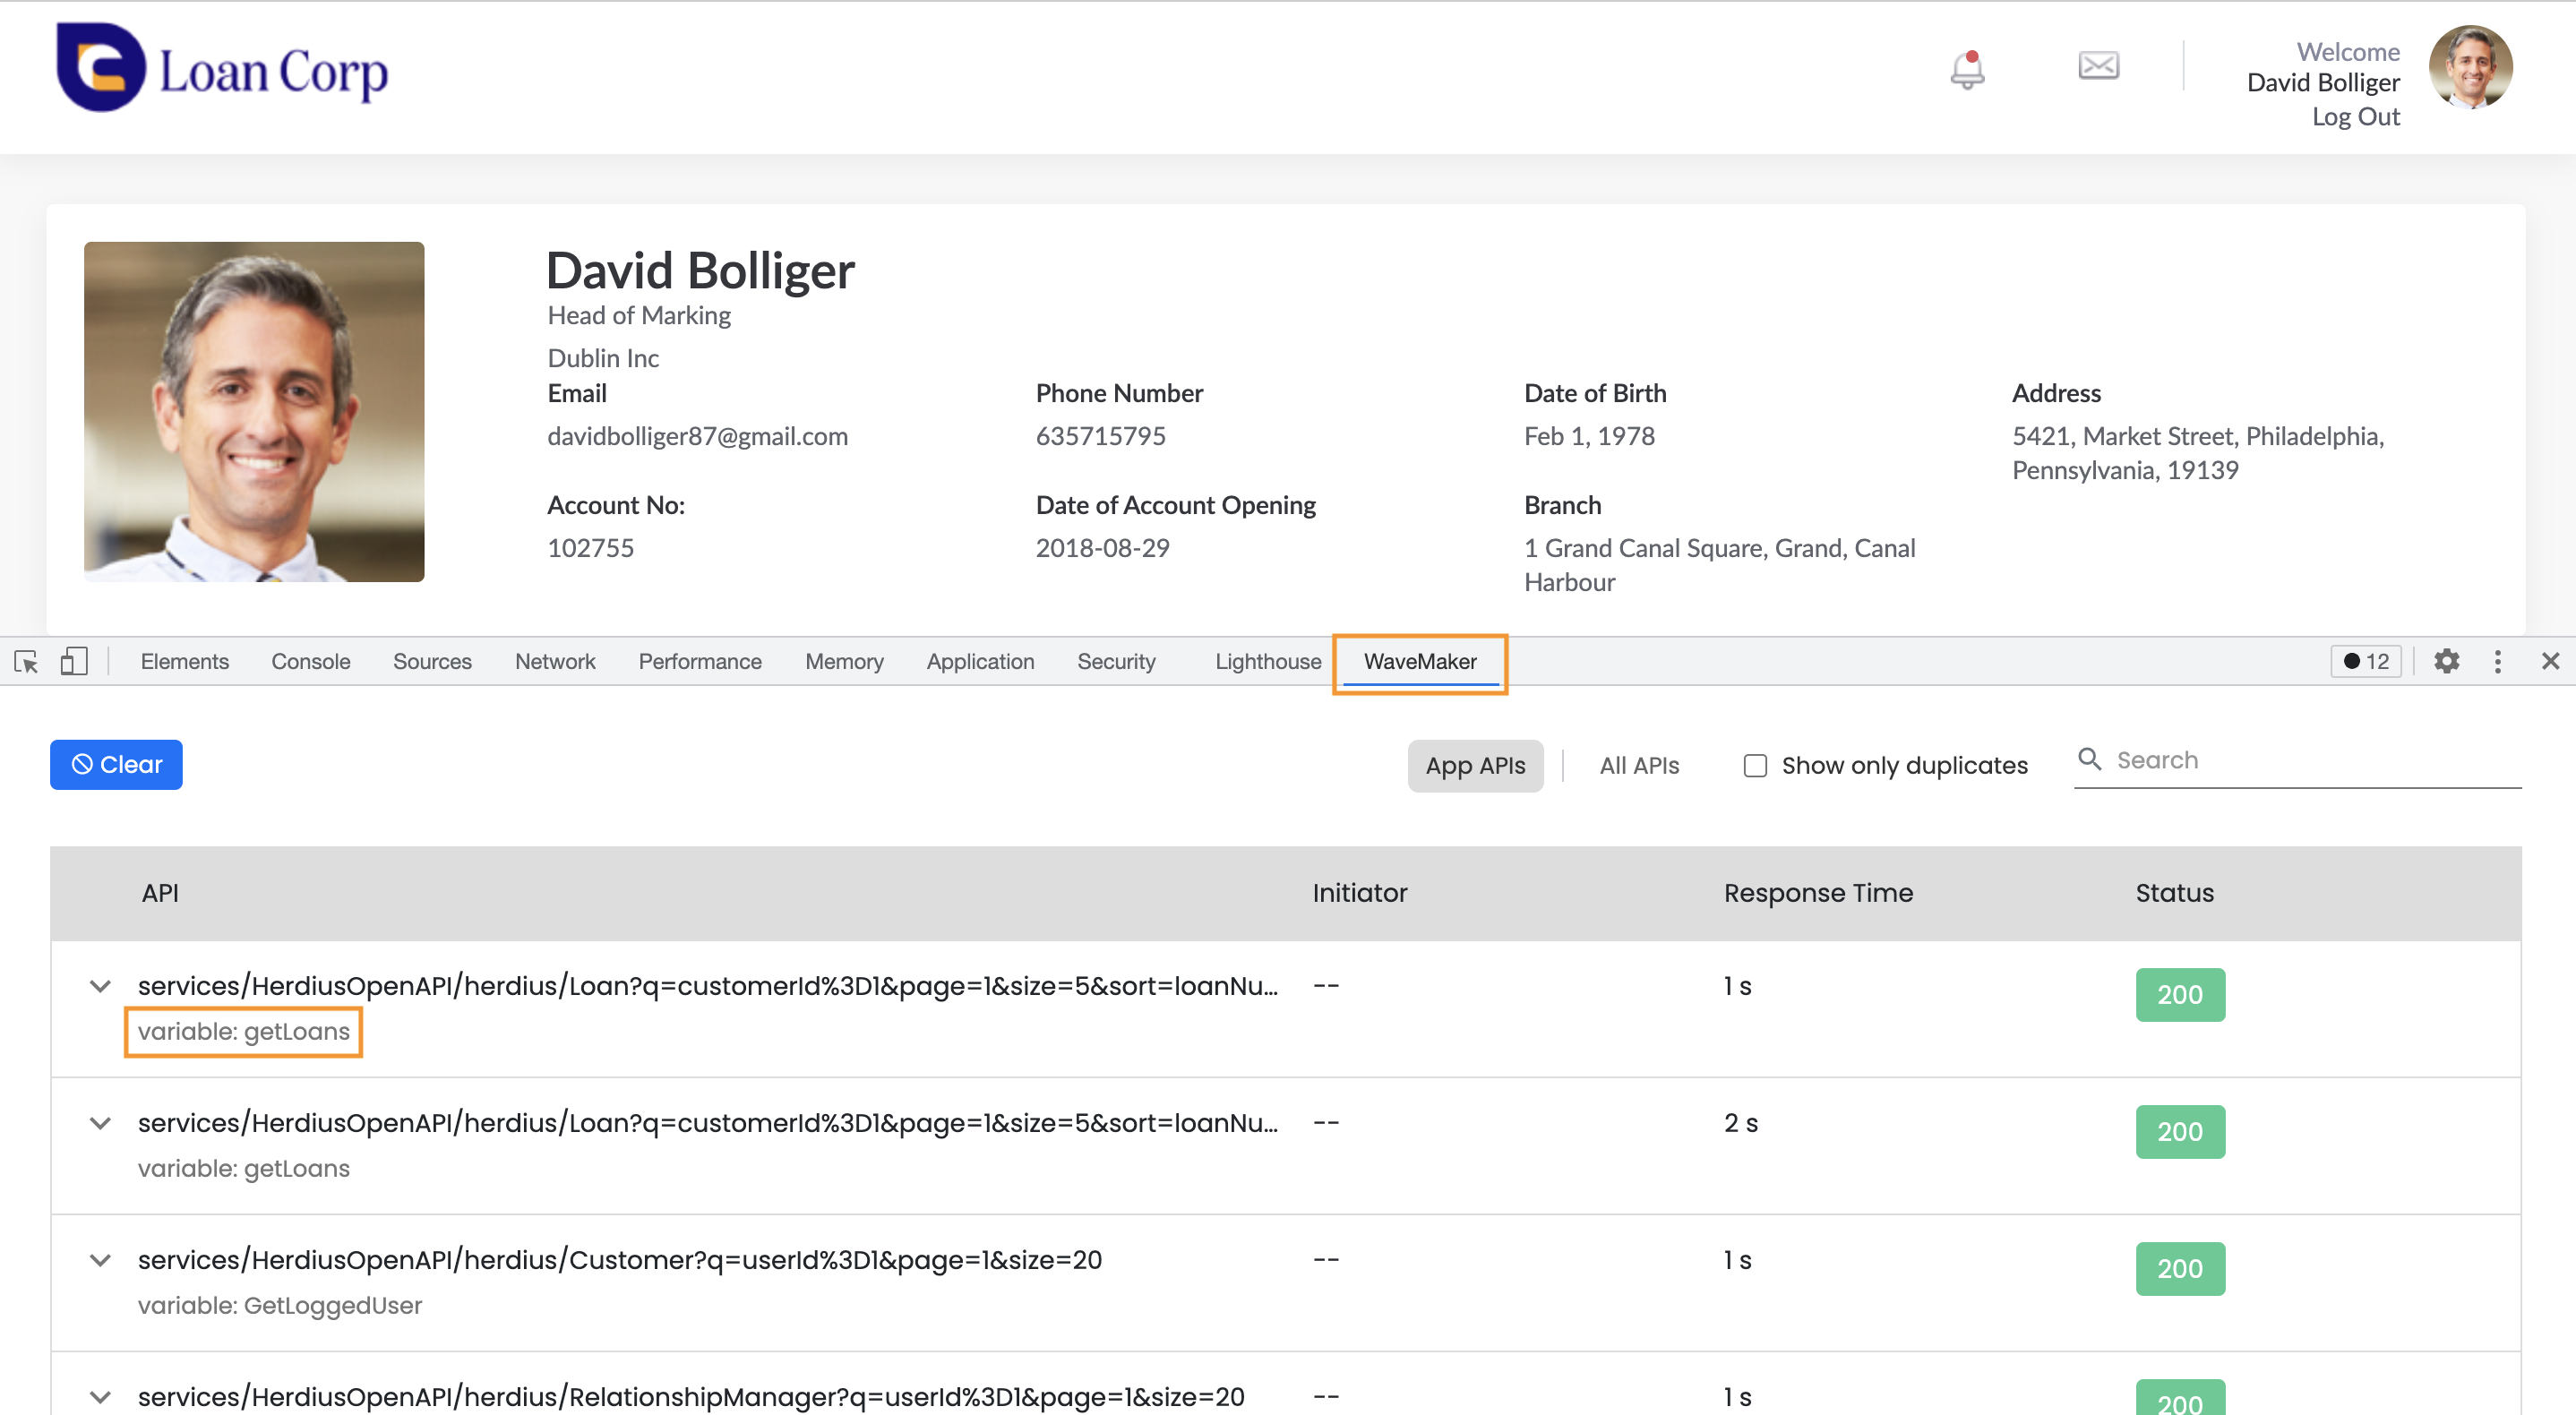
WaveMaker Devtool is a Google Chrome extension, an addition to the existing Google Chrome developer tools that allow you to debug and monitor WaveMaker applications in preview mode. Accessible via the Inspect option.
WaveMaker Devtool supports WaveMaker 10.14.0 and later.
Devtool Installation
Devtool Extension: Devtool
Prerequisites
- Google Chrome browser
- Be Logged into WaveMaker to view the logs
Who can use WaveMaker Devtool
All WaveMaker users who use Google Chrome to preview the application can install the WaveMaker Devtool extension and use it.
Why WaveMaker Devtool
Typical challenges that WaveMaker application developers experience while debugging include:
- Developers have to go through many application logs when an issue is observed; for example, when adding new changes to the application, the page does not load.
- Developers often miss immediate details of the issue to determine which variables are responsible for the request and fix the encountered issue.
How Devtool can help
WaveMaker Devtool Chrome extension helps ease the debugging process and improve the application performance. Once you install the extension and preview a WaveMaker application on Preview mode, you can:
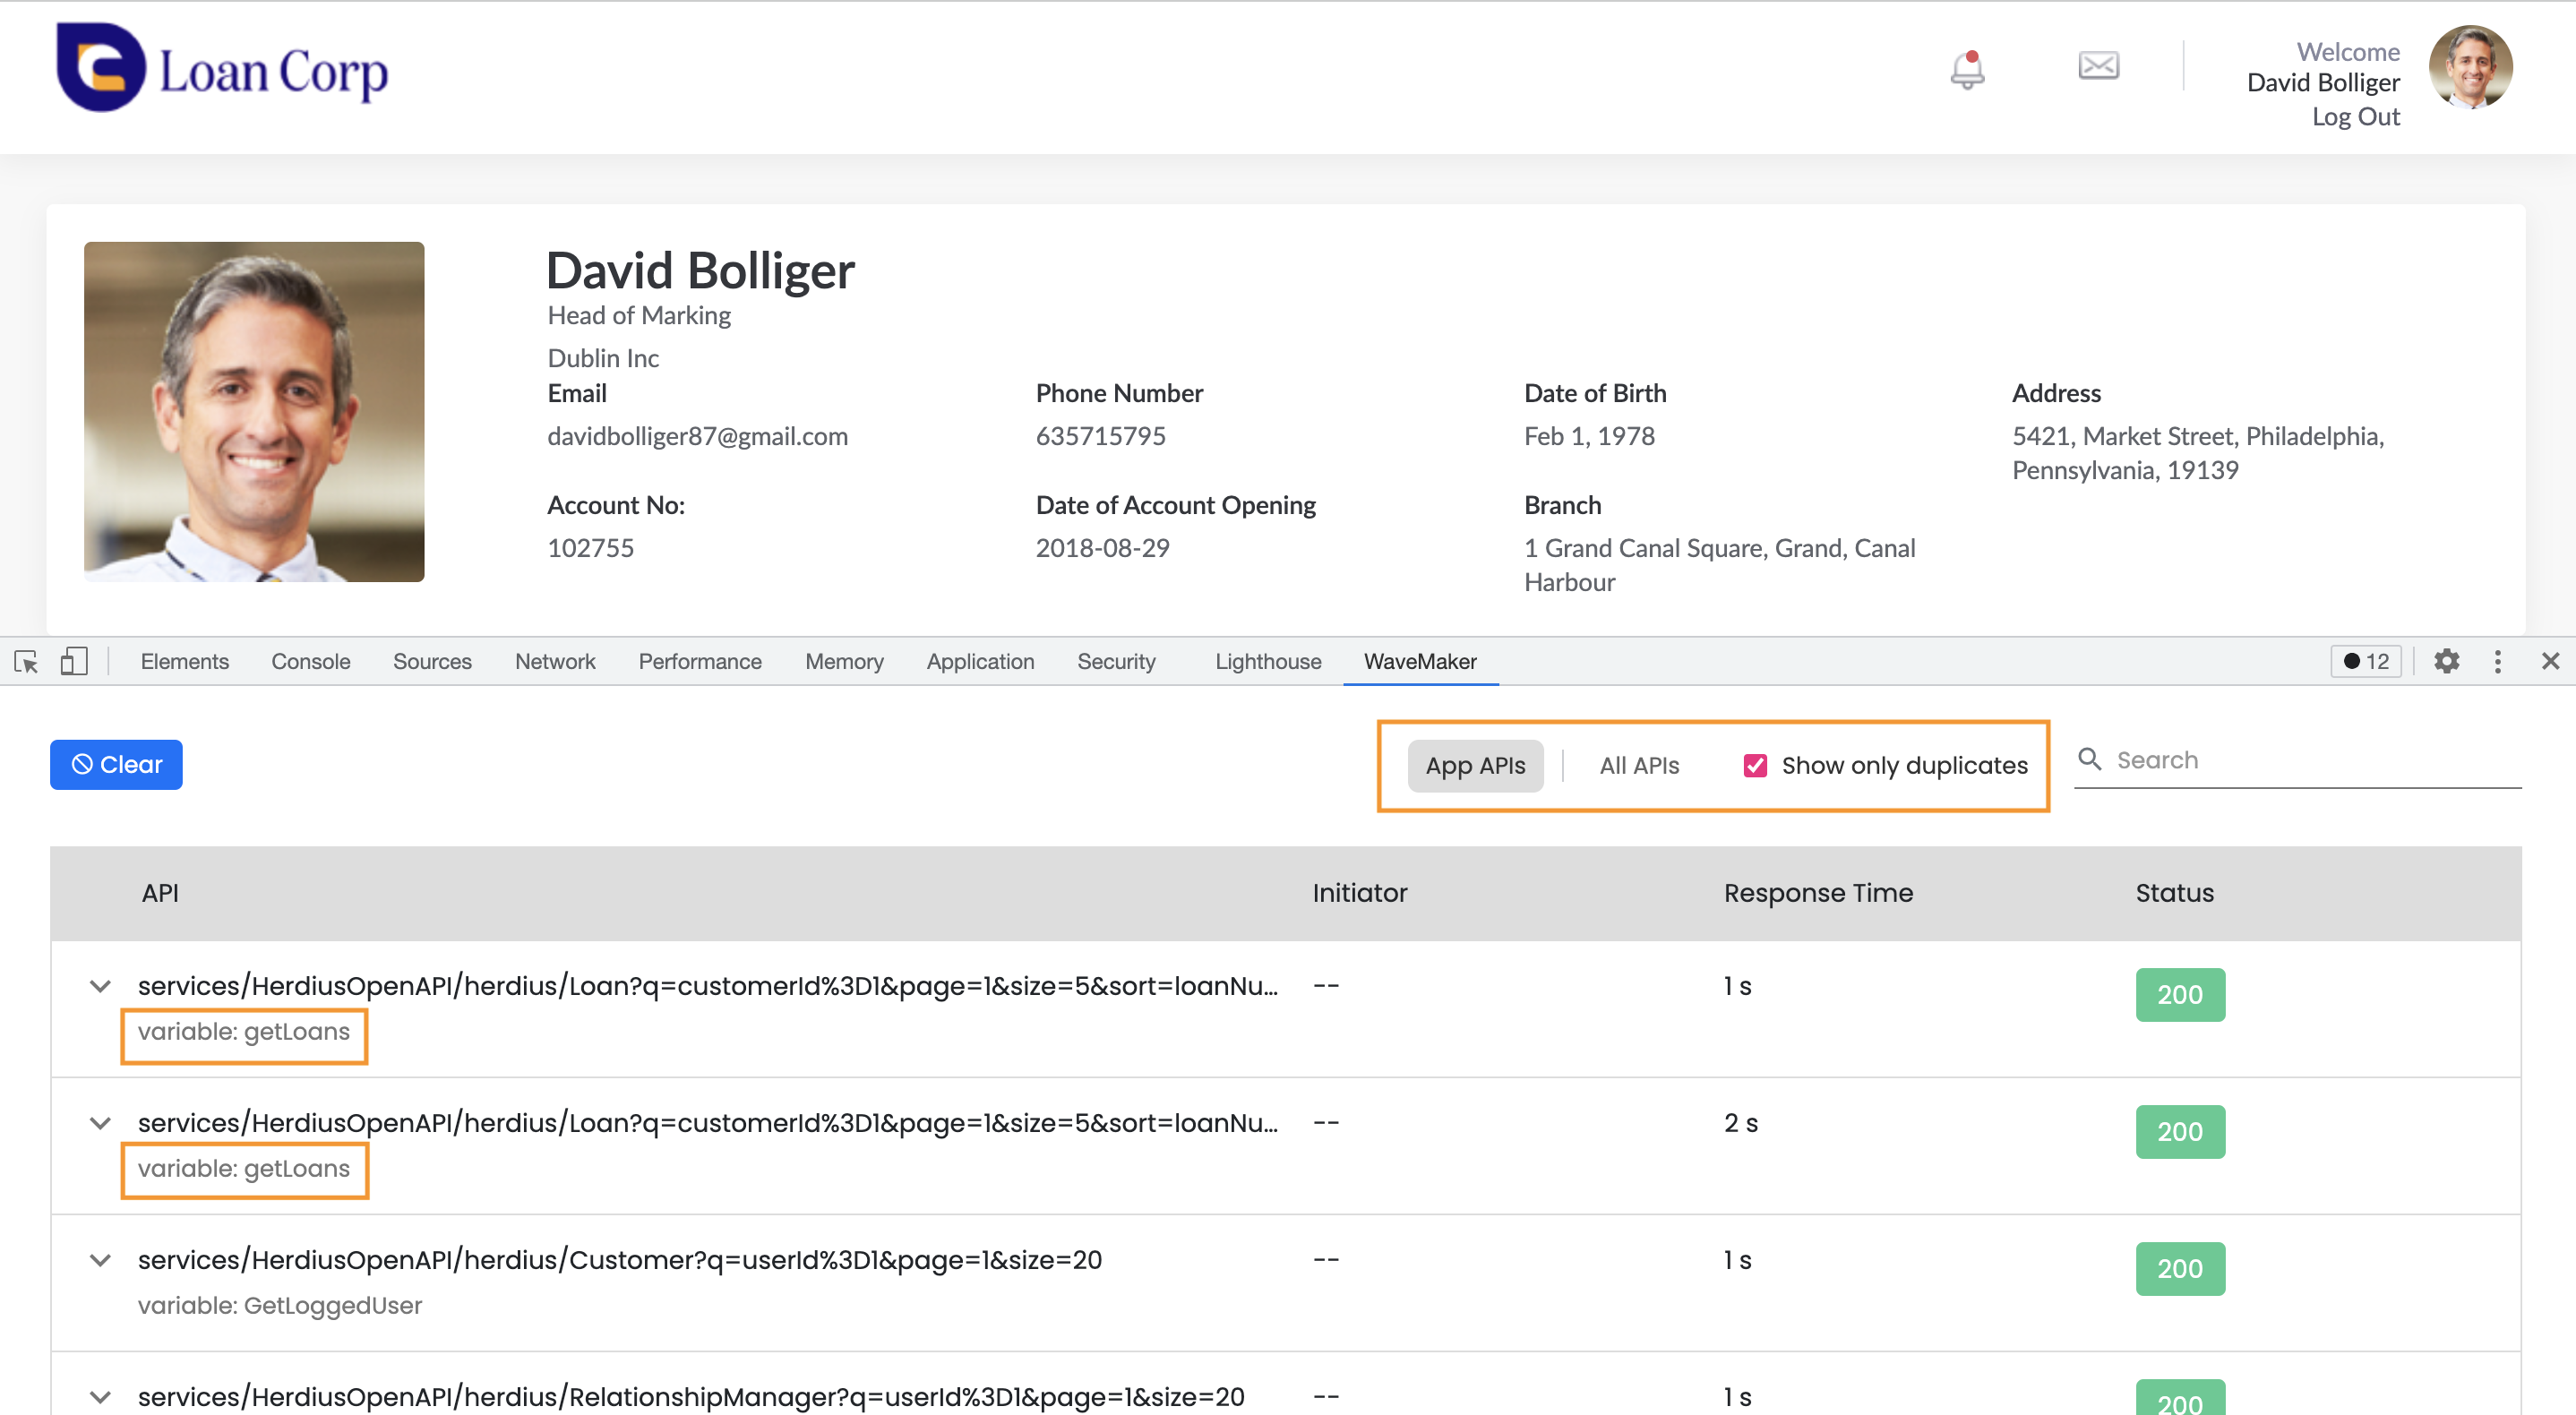
- View the duplicate requests triggered on the page using the Show only duplicates option.
- Find the Variable associated with each request along with the request URL.
- You can switch to All APIs to view all the requests triggered by the page. By default, the page shows App APIs.
Enabling Logs
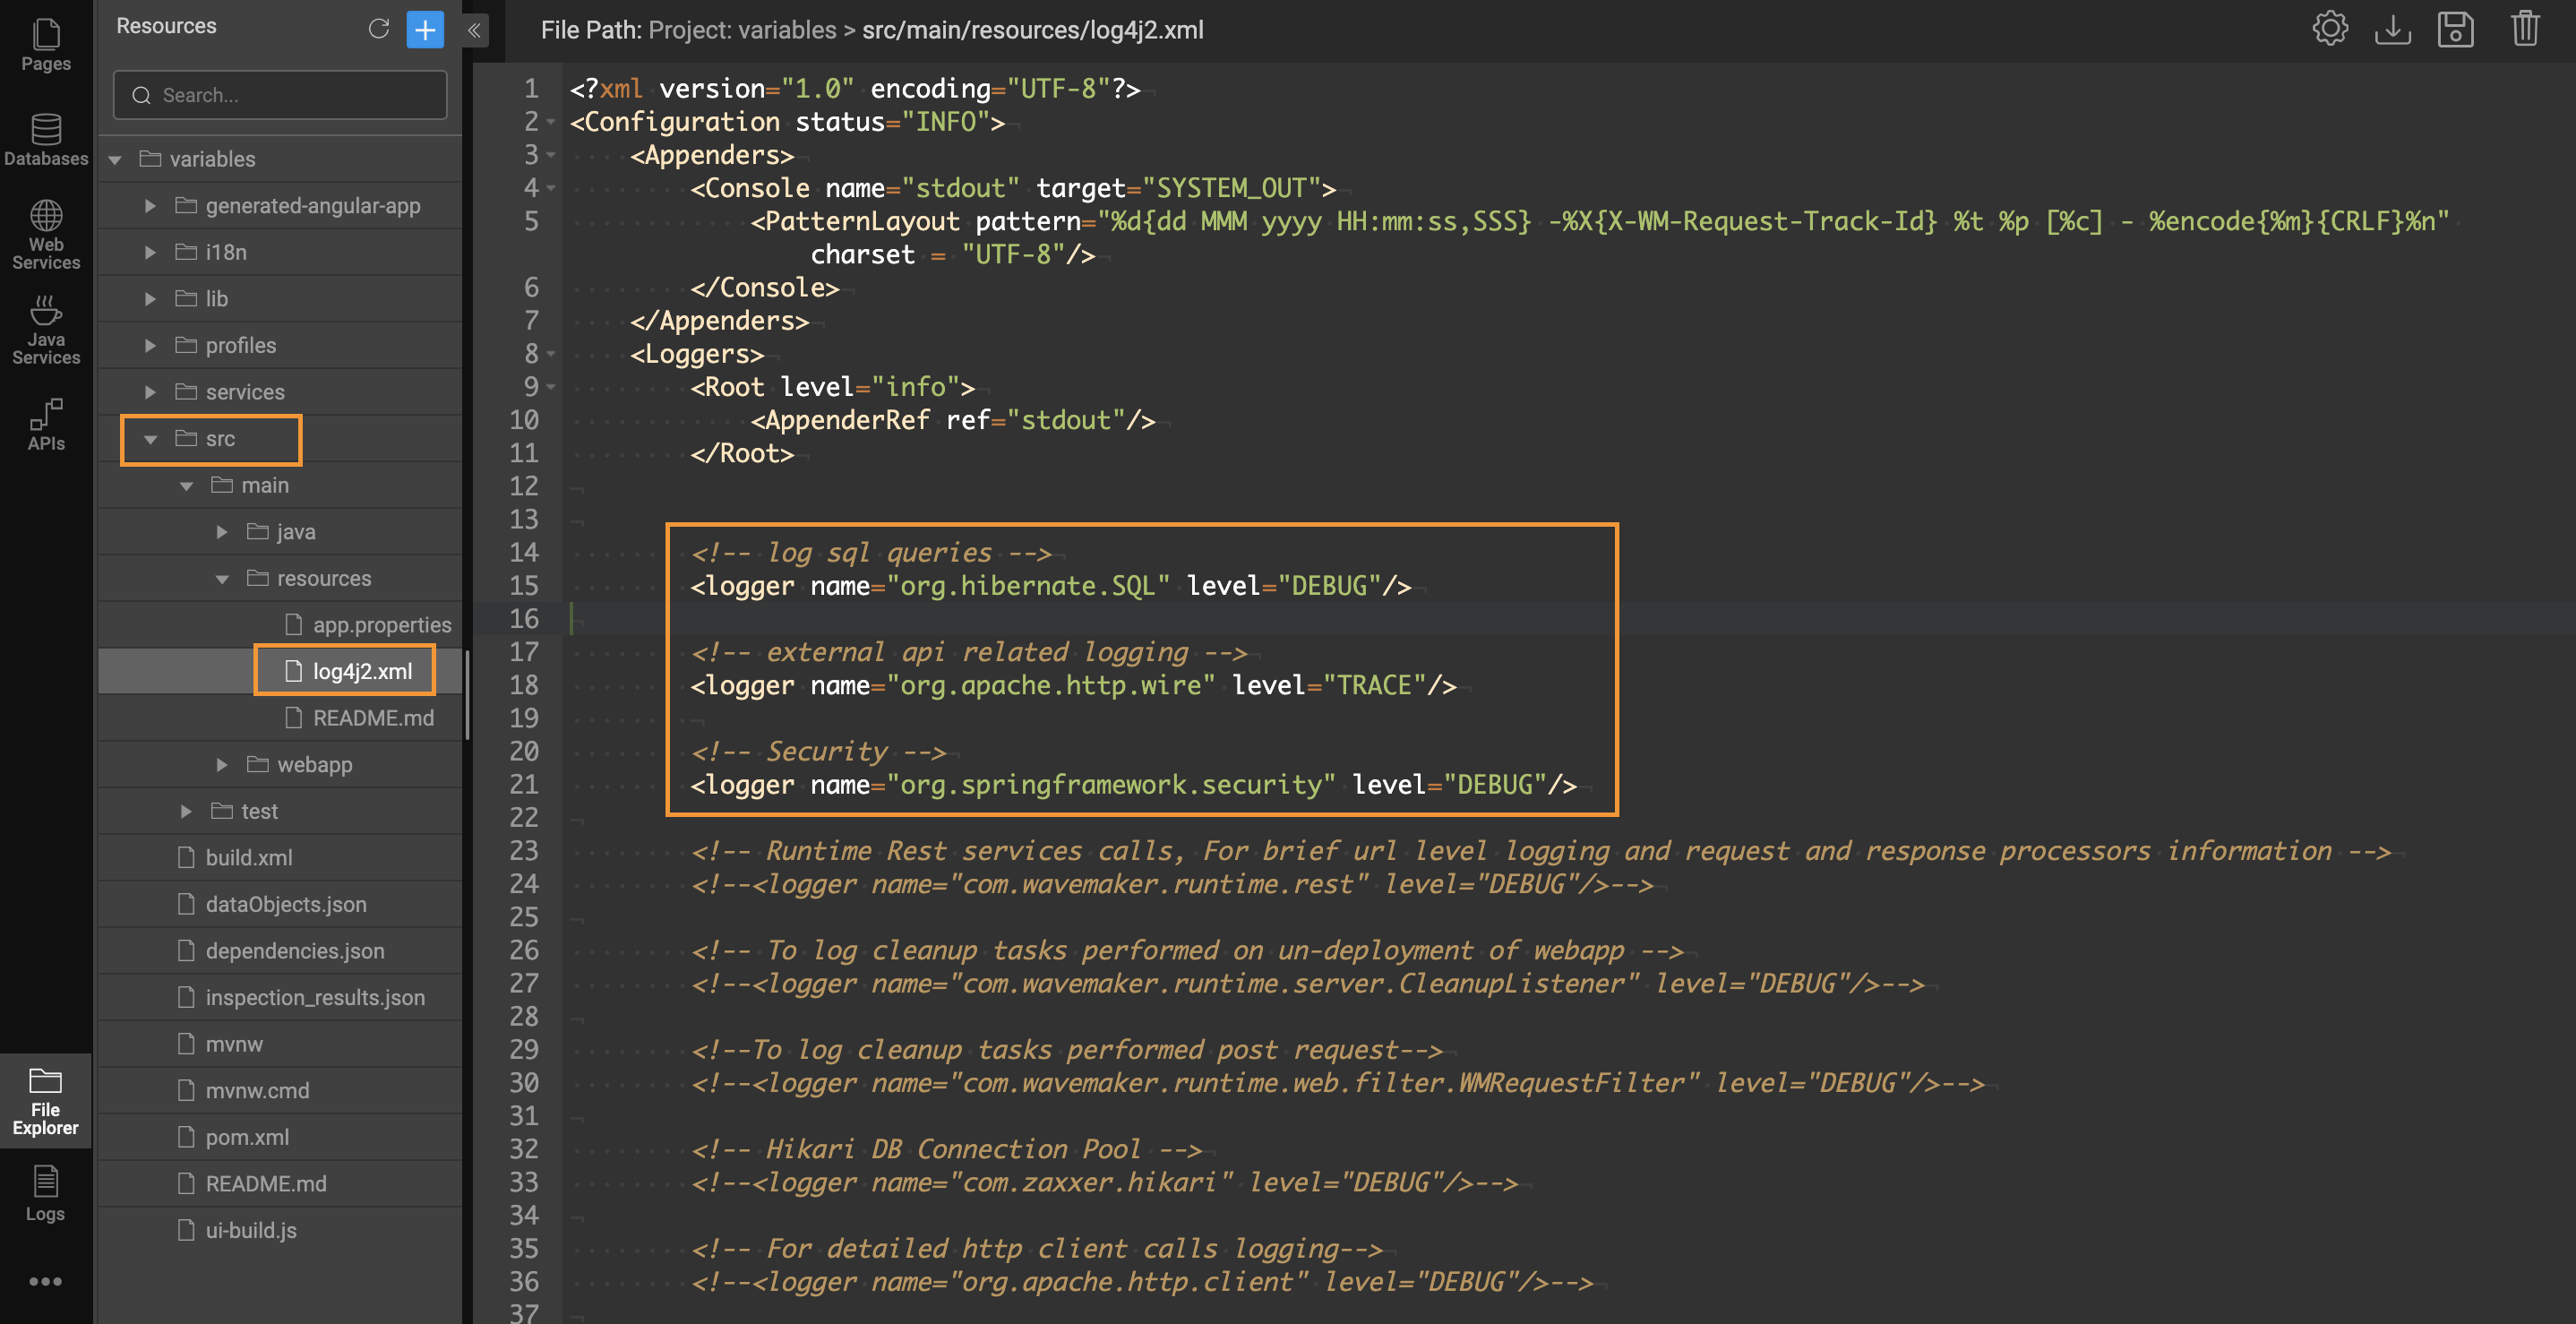
To enable logs, include the following code snippet in the log4j2.xml file in the src folder under the FileExplorer panel.
Enabling WaveMaker Devtool in Incognito mode
WaveMaker Devtool can be accessed in Incognito mode with 2 simple steps


