Debugging Mobile Apps
WaveMaker uses Cordova platform to build hybrid mobile apps. While Cordova handles the native JavaScript API binding, WaveMaker handles the core app logic and UI. A mobile app built using WaveMaker runs in a web view (equivalent to a web browser). How to debug the web view layer is explained below.
Debugging on Android
Requirements
- Android Mobile
- An App (to debug) built on Cordova
- Desktop/laptop with chrome browser
Enable USB debugging in Android (one-time setup)
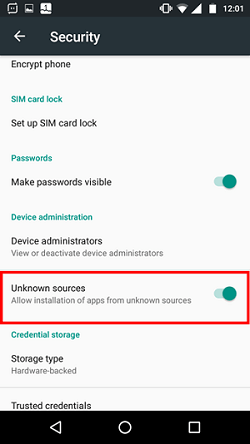
On your android mobile, go to Settings > Security. Enable ‘Unknown sources: Allow installation of apps from unknown sources’

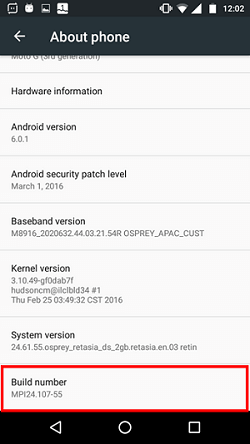
Go to Settings > About Phone. In ‘About Phone’ page, click on build number for 7 times to enable developer options.
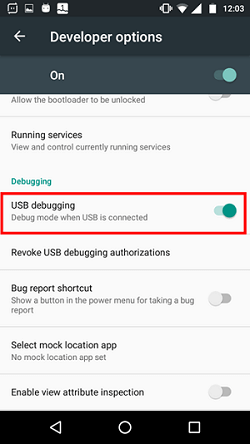
Go to Settings > Developer Options. Enable USB debugging.


Debugging mobile app
- Open the app on mobile and connect mobile to a desktop with a USB cable.
- On the desktop, open a chrome browser and go to ‘chrome://inspect#devices’. All available apps for debugging are shown on that page.
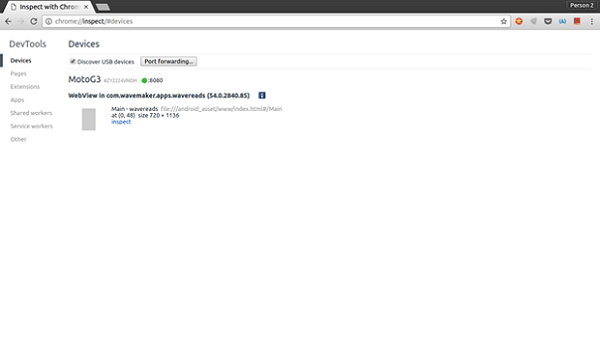
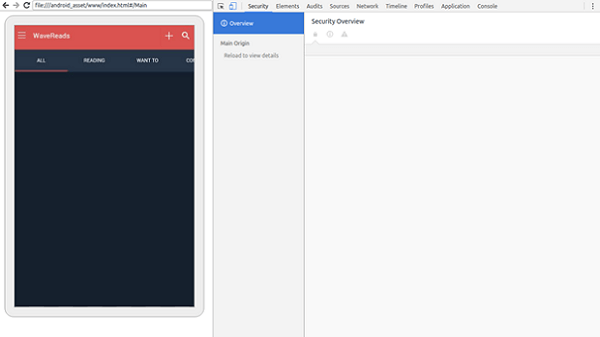
- Click on inspect link that appears below to your app.Chrome debugging tools will open and you can debug the app.
Debugging on IOS
Requirements
- iPhone
- Mobile app built on Cordova
- MacBook (or Mac Pro or Mac Mini) with safari browser
Enable Safari Web Inspector (one-time setup)
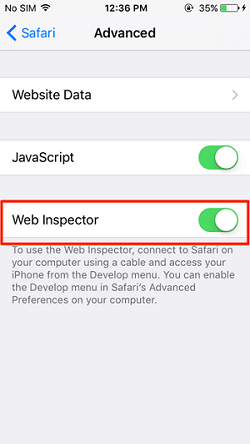
On iPhone
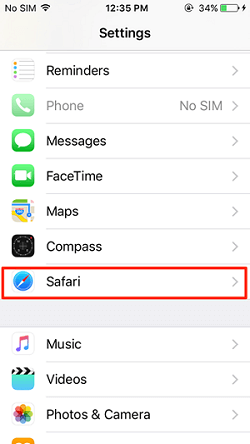
- Open Settings and Tap on Safari
- In Safari Settings, Tap on Advanced
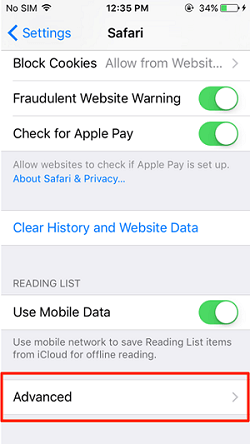
- Turn on Web Inspector.
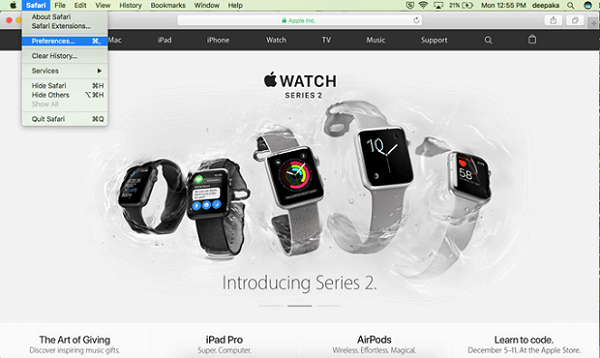
On MacBook
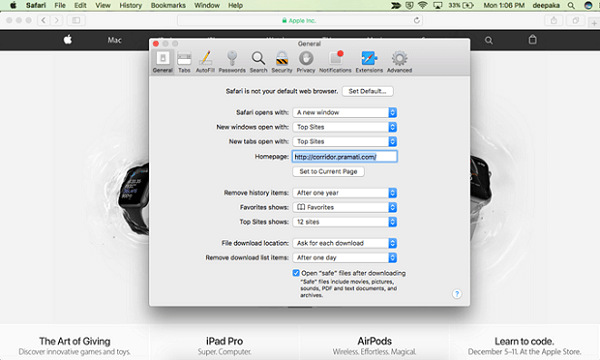
- Open Safari browser > preferences
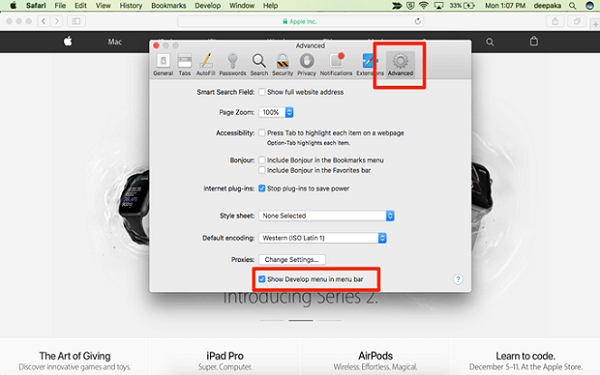
- Go to Advanced and check on ‘Show Develop Menu in menu bar’
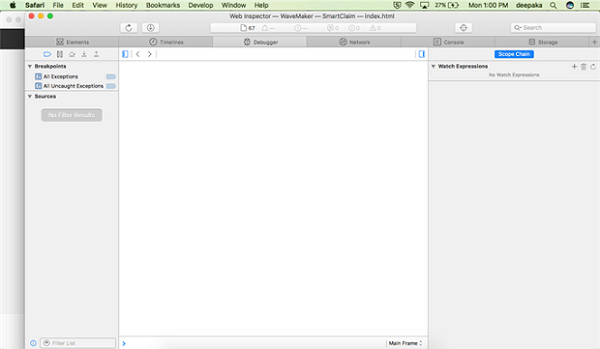
Debugging Mobile App
- Open the app to debug on iPhone.
- Connect iPhone to a MacBook with a USB cable.
- Open Safari in a MacBook, and click on ‘Develop’ menu.

- Under Develop menu, all connected devices (iPhone) are listed.Under each Device sub-menu, all apps available to debug in that device are listed.
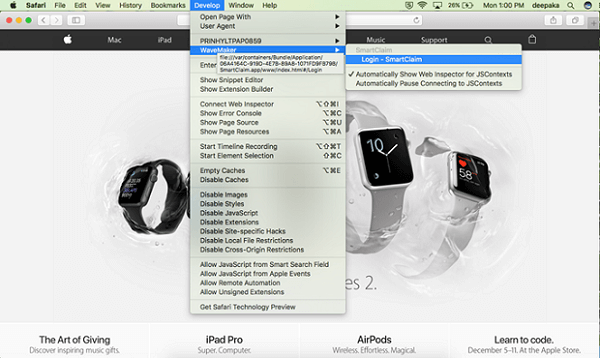
- Click on the app’s page to open the debugger.