Metrics Collection
Metrics is needed to get realtime application performance insights.
In WaveMaker platform, we have integrated the Prometheus monitoring tool. Prometheus is widely used and has a lot of opensource modules and tools which are easy to integrate.
The following tools are integrated with Prometheus in WaveMaker Platform
| tools | Description |
|---|---|
| cadvisor | Collects container level resource utilization, performance and health related metrics |
| node_exporter | Collects node (Instance) level resource utilization, performance and health related metrics |
| jmx_exporter | Collects jvm level classloader, thread, heap, GC related metrics |
| micrometer | This is used to collect any custom metrics from the java web application deployed as a microservice in a container. |
With the help of the above tools, all the data is aggregated at Prometheus.
Architecture
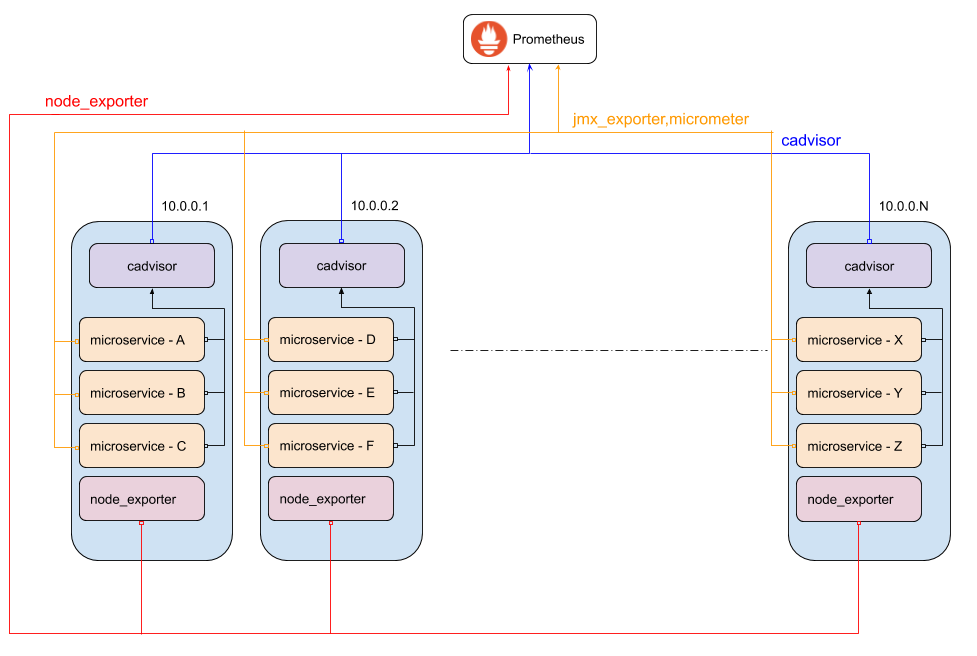
The below image shows how Prometheus is integrated with the components in the Platform.

Here, The microservice containers labeled A-Z are spread across instances 10.0.0.1 - 10.0.0.N
node_exporter: All the instances 10.0.0.1 - 10.0.0.N contain a node_exporter container which collects the node (Instance) related metrics
cadvisor: Every instance contains a cadvisor container which collects the container metrics related to all the other containers present in the same instance
jmx_exporter, micrometer: Every JVM application deployed as a microservice in containers A-Z generates its own metrics.