Prometheus
From Metrics Collection, we know that Prometheus is used to collect the metrics from all the components in a platform. Besides this, Prometheus provides a UI as well where complex queries can be executed on any metrics generated by the platform.
Using Prometheus UI, we can not only see the current metric value but also visually see the historic graphs related to that metric. This is very helpful to analyze an incident that has occurred in the past.
How to access Prometheus
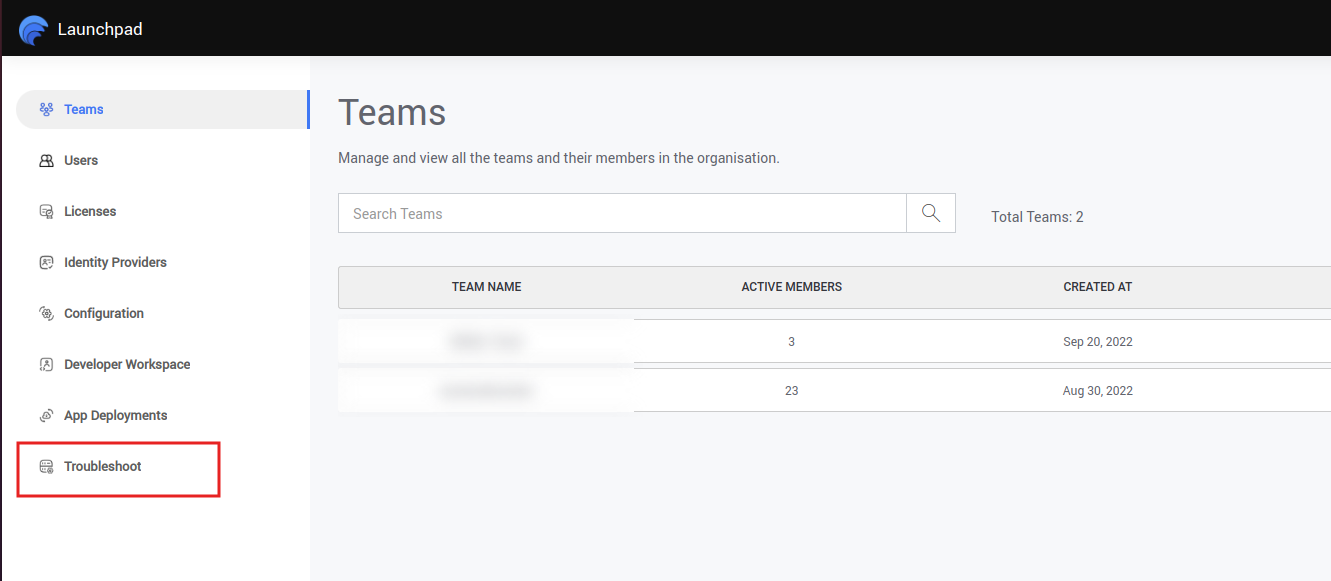
1) After the WaveMaker login, open the Launchpad and click the Troubleshoot located on the bottom left as shown below.
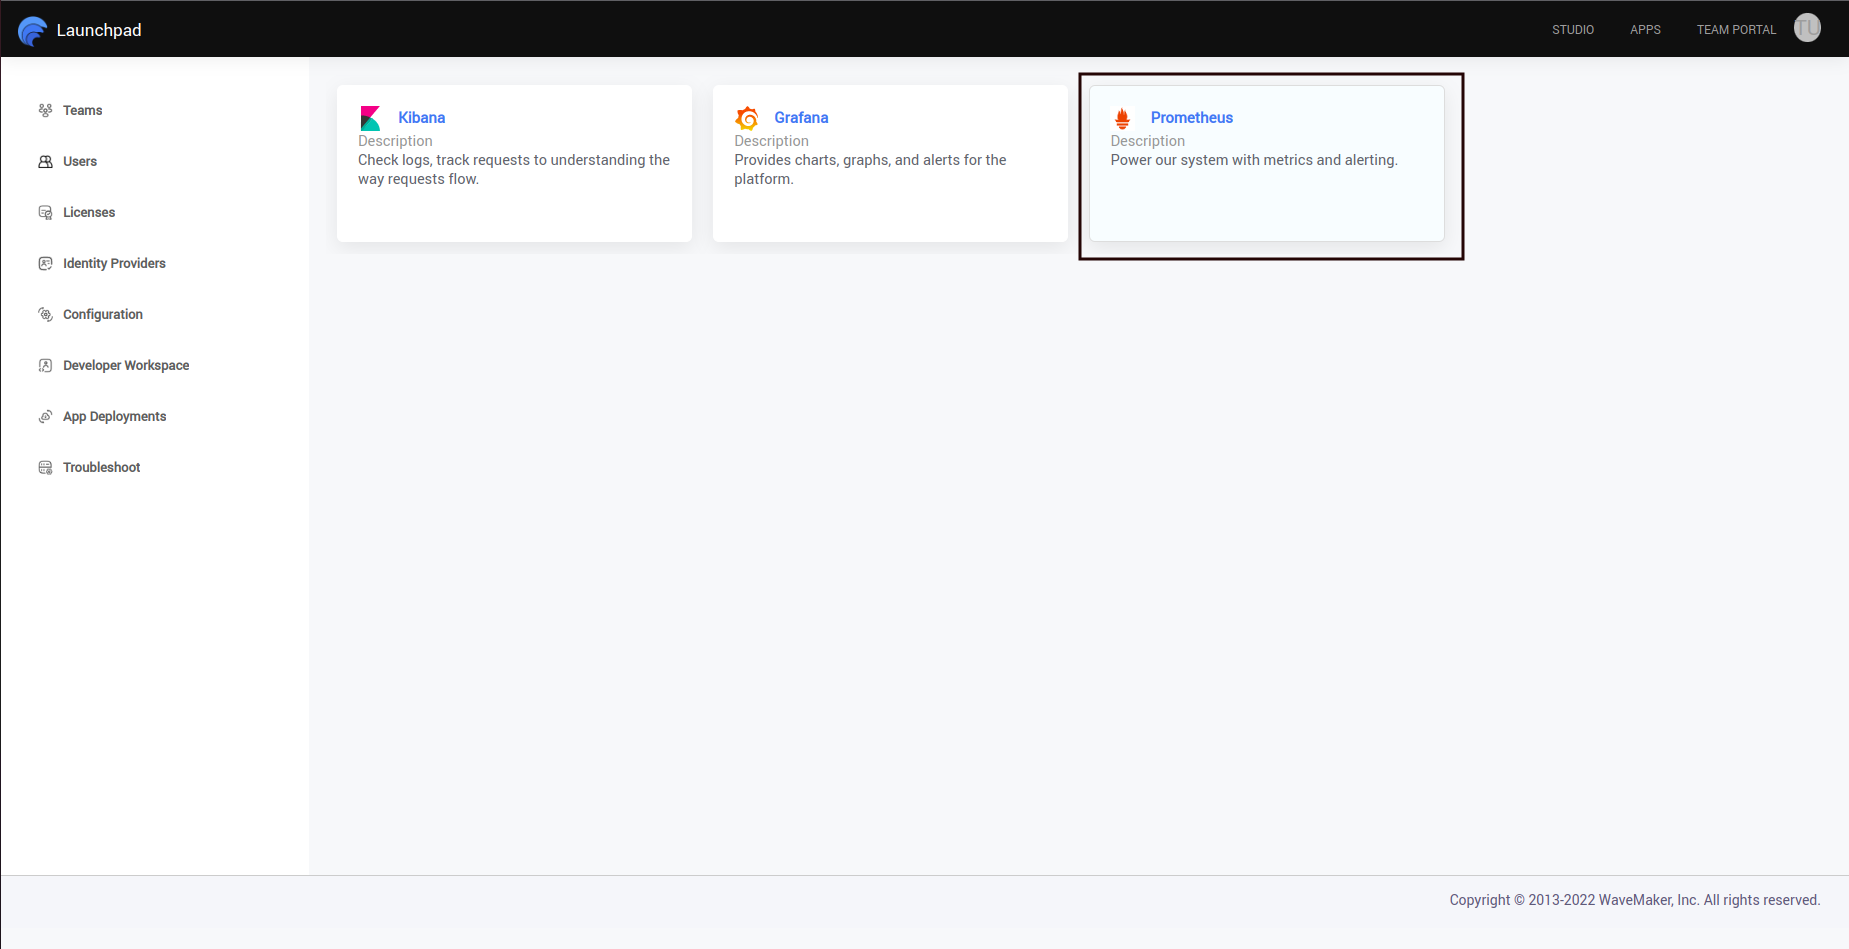
2) In the dial menu, click the Prometheus button as shown below
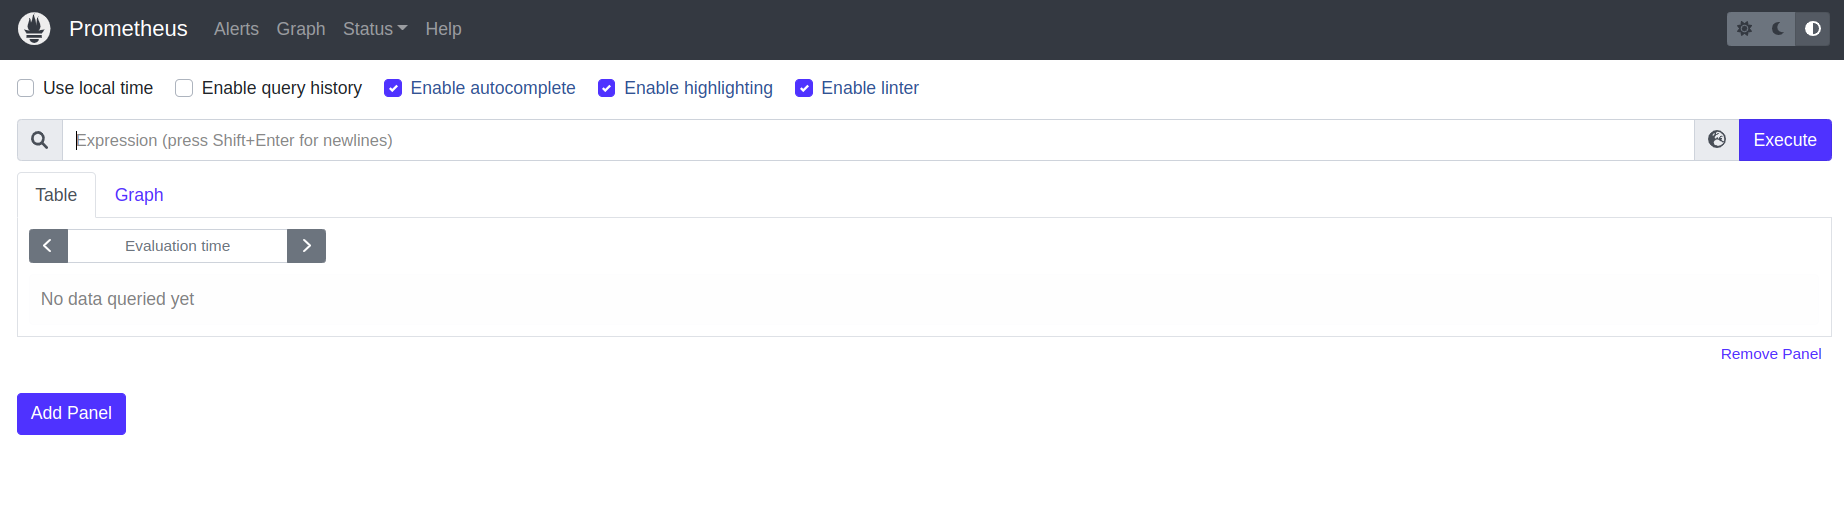
3) It opens the Prometheus UI. It should look like the below image
Prometheus Metrics
It is very difficult to list down all the metrics which can be accessed using in Prometheus UI as there is a wide range of metrics which is collected by Prometheus and most of the metrics are provided by the tools used which might vary over time.
As Prometheus has a learning curve the below table lists out a few basic metrics which will help you to start and understand the Prometheus querying tool.
| Metric | Description |
|---|---|
up | Represents the health status of an application. Here 0 represents inactive and 1 represents active |
wm_active_users | The number of active user sessions in the platform |
wm_concurrent_api_calls | The number concurrent API calls being served by a microservice |
wm_used_user_allocations | The number of user containers created |
wm_available_user_allocations | The maximum number of user containers which can be created besides the currently created user containers |
http_requests_seconds | The HTTP calls made. This metric includes uri tag to analyze the HTTP calls based on a particular URI |
java_lang_Memory_HeapMemoryUsage_used | The application JVM heap memory in bytes |
container_memory_rss | The container RAM utilization in bytes |
node_cpu_seconds_total | The time spent by the machine CPU on each mode. Different modes can be filtered using the mode tag |
Additionally, the metrics generated by cadvisor, node_exporter, jmx_exporter, micrometer, can also be used in the Prometheus UI.
Prometheus Querying
Besides getting the metric value, we can also write Prometheus Queries in the Prometheus UI tool as shown in the below example.
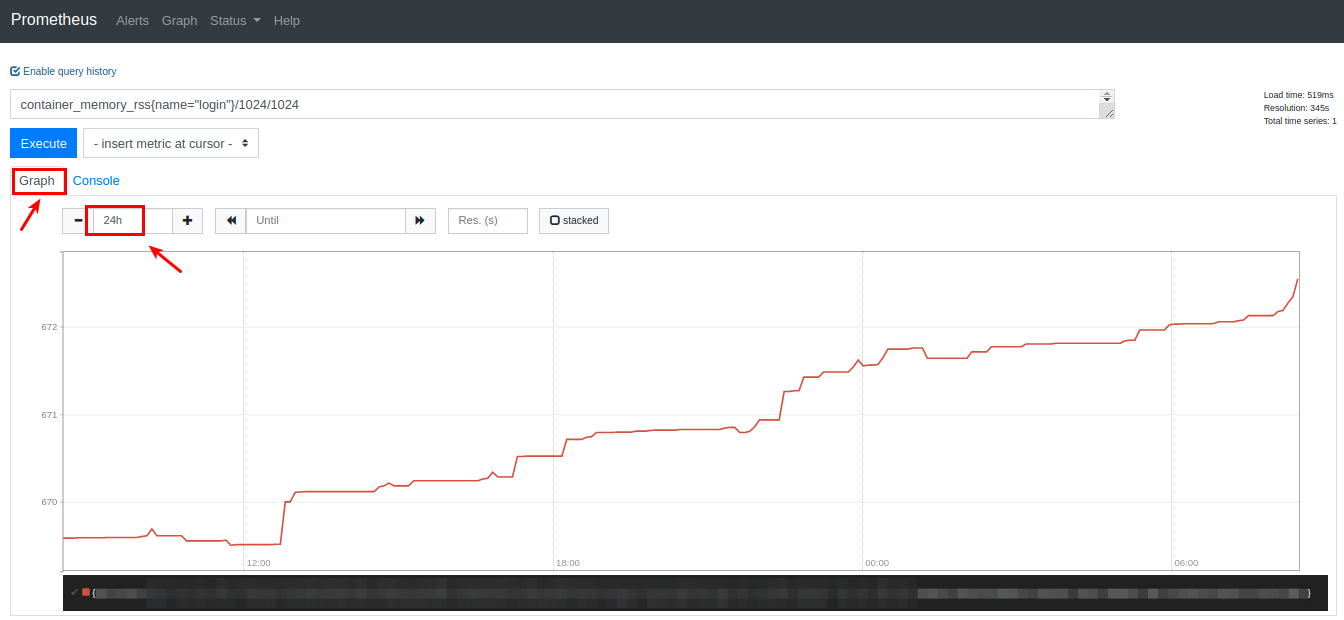
Let's say we want to check the RAM consumption of the login container for the past 24 hours. We want the value to be in MBs for better understanding.
1) As we already know from the previous table, we can use container_memory_rss to get the memory of a container.
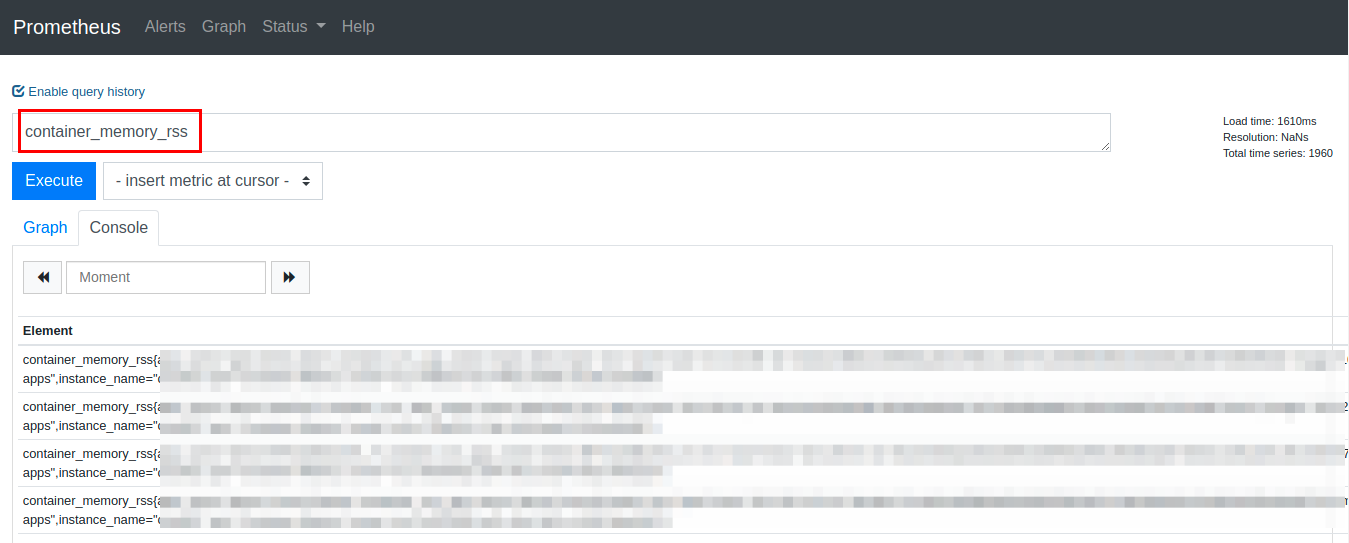
2) In the above image, we can see that the query has returned the memory metrics of multiple time series. We can select only the login metrics by using the query container_memory_rss{name="login"} as shown in the below image.
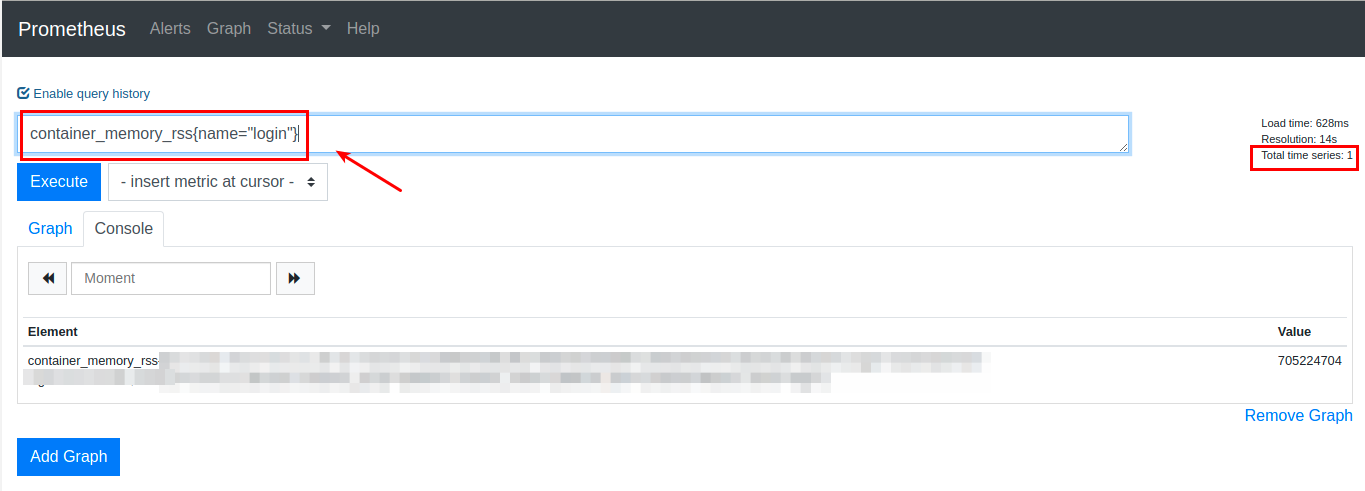
3) In the above image, the memory is shown in bytes, you can convert it by simply dividing it container_memory_rss{name="login"}/1024/1024
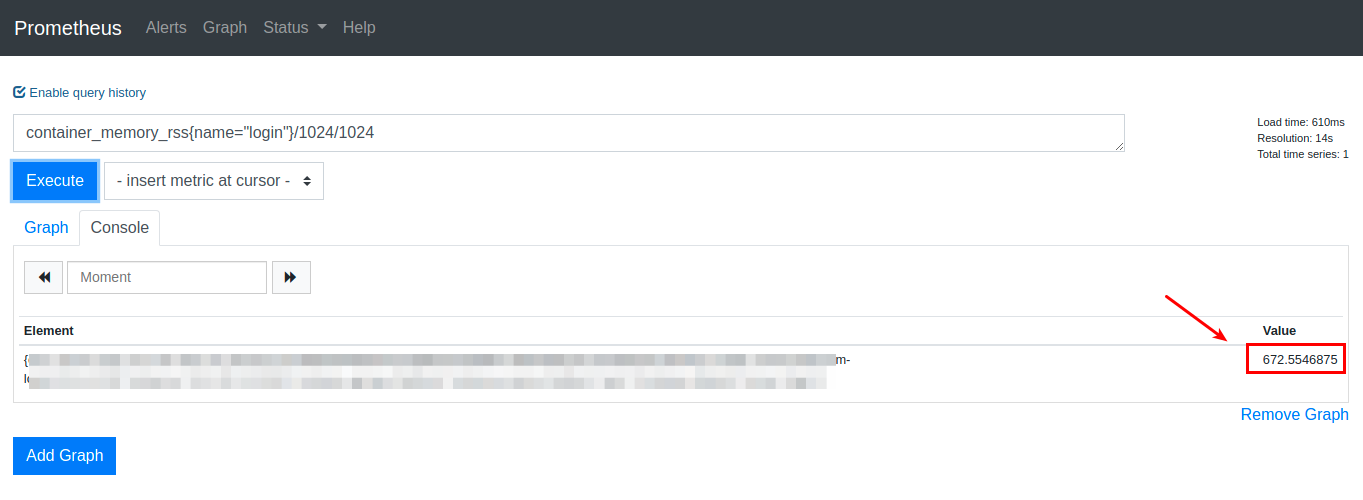
4) Finally, after preparing the query, you can check the graph of the last 24 hours by clicking on the "Graph" button and setting the range to 24h as shown in the below image