React Native DevTools
React Native DevTools is the new debugging tool for Expo and React Native apps (since version 0.76), replacing Chrome DevTools. This guide explains how to use it to check re-renders and analyze performance, especially for WaveMaker apps.
Generally, too many re-renders can slow down React Native apps. React Native DevTools can highlight component re-renders as they happen, helping you identify unnecessary updates and optimize your application's performance on mobile devices.
React Native DevTools provides access to console, sources, memory, components, and profiler tabs, with built-in support for React DevTools functionality.
Prerequisites
Before you begin, ensure you have the proper setup:
- React Native 0.76 or later (React Native DevTools replaces Chrome DevTools)
- Development mode - Ensure your React Native app is running in development mode
Opening React Native DevTools
To open React Native DevTools:
- Start your app with Expo CLI or React Native CLI
- Press
jin the terminal where Expo or React Native starts - React Native DevTools will open in a separate window automatically
For detailed setup instructions, refer to the official Expo debugging documentation.
Debugging React Components
Components Tab
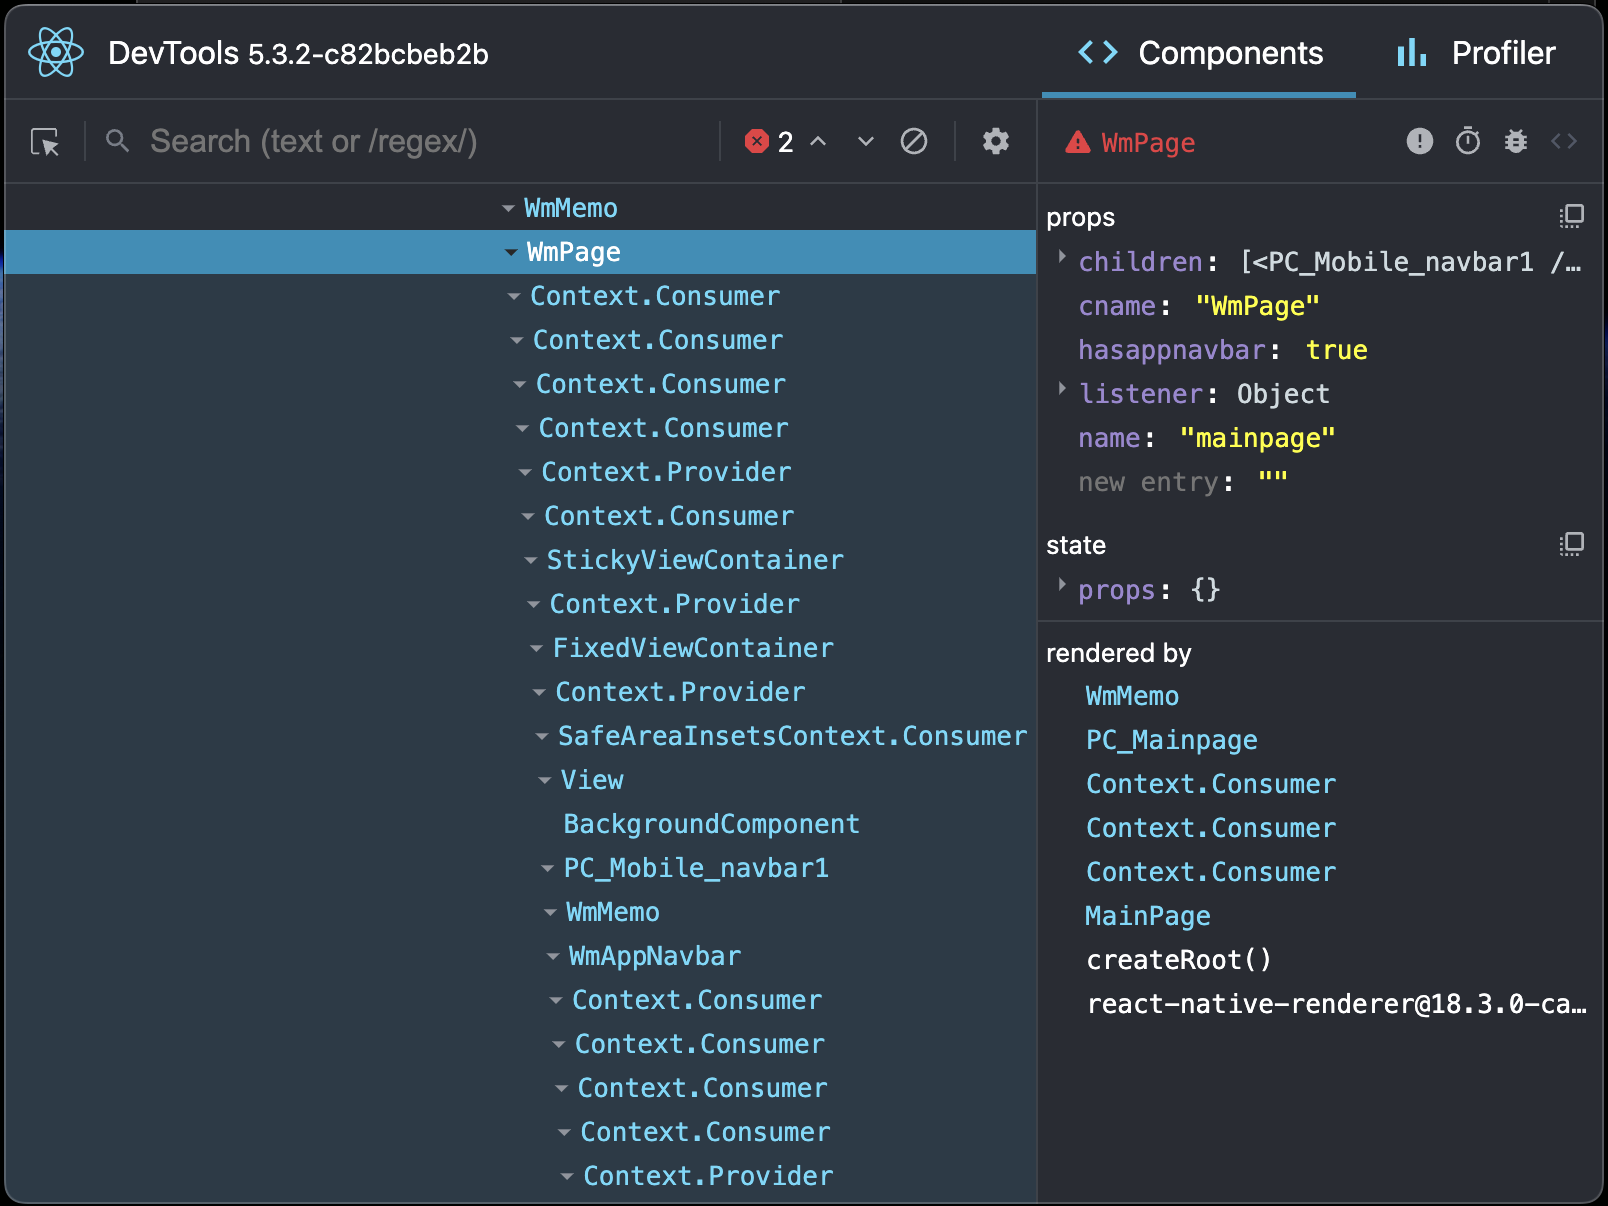
The Components tab shows the structure of your React Native app. It lets you see all components in a tree-like view, check their props and state, and watch how they update in real time when the app re-renders.
Accessing Component Tab
There are two main approaches depending on your React Native version and setup:
Option 1: React Native DevTools (React Native 0.76+)
For React Native 0.76 and later versions, React Native DevTools includes built-in React DevTools functionality:
- Open React Native DevTools by pressing
jin your terminal where you started your development server - Navigate to the Components tab (one of the available tabs alongside console, sources, network, memory, and profiler)
- The component tree will display your React Native app's component hierarchy with built-in React DevTools features
Option 2: Standalone React DevTools (All React Native versions)
For older React Native versions or when you prefer using standalone React DevTools:
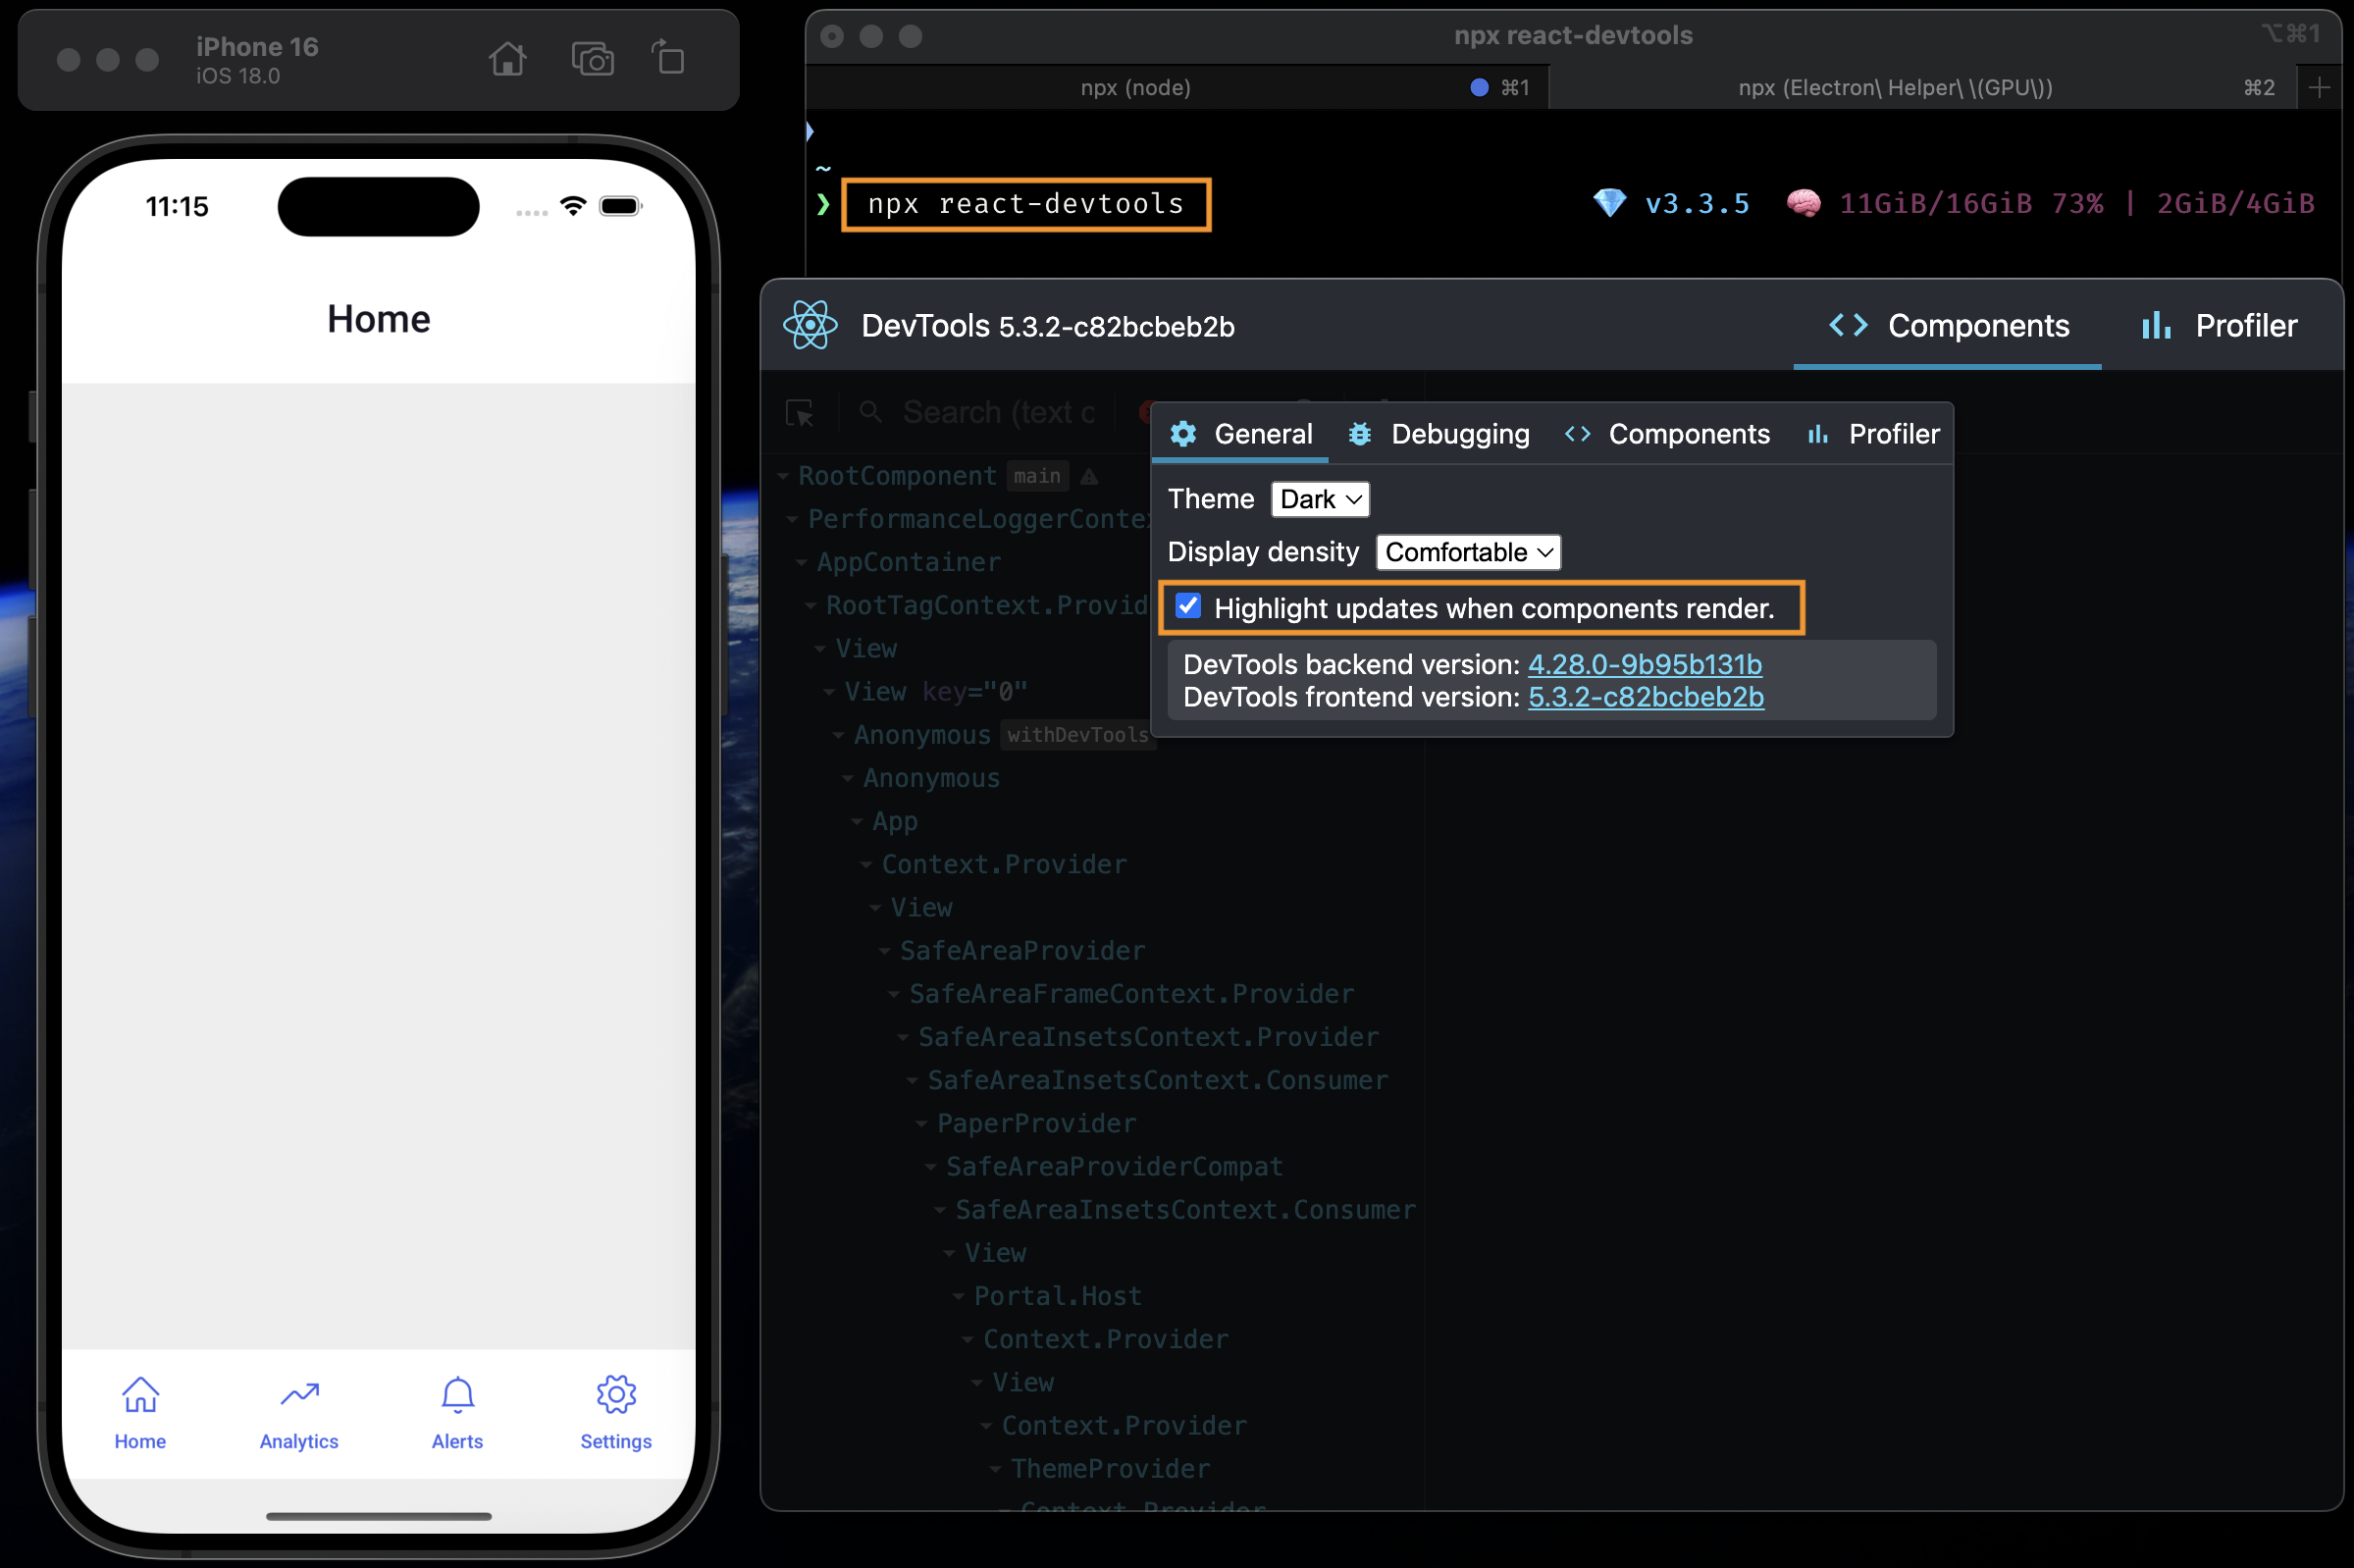
Install react-devtools globally:
Start react-devtools in a separate terminal:
Connect your app to react-devtools:
- For Expo: React DevTools should connect automatically when you start your app
- For React Native CLI: Ensure your app is running in development mode and react-devtools will connect automatically
The React DevTools window will open with the Components and Profiler tabs available
Enabling Highlight Updates
To visualize component re-renders:
- In the Components tab, click the settings gear icon in the top right corner
- Enable "Highlight Updates" from the settings menu
- Interact with your app to see components flash with colored borders as they re-render
Understanding Update Highlights
Once enabled, interact with your React Native app to see components flash with colored borders as they re-render:
- Blue: Infrequent updates - Generally acceptable
- Green: Moderate updates - Monitor for optimization opportunities
- Yellow: Frequent updates - Potential performance concern
- Red: Very frequent updates - Requires immediate attention
Inspecting React Native Components
- Click on Components in the component tree to examine their props and state
- Look for unexpected re-renders in native components (View, Text, ScrollView, etc.)
- Identify React Native-specific performance bottlenecks like unnecessary bridge communications
- Use the search functionality to quickly find specific components in large component trees
Profiler Tab: Deep Performance Analysis
The Profiler tab provides detailed performance metrics specifically tailored for React Native applications using the built-in React DevTools profiler functionality.
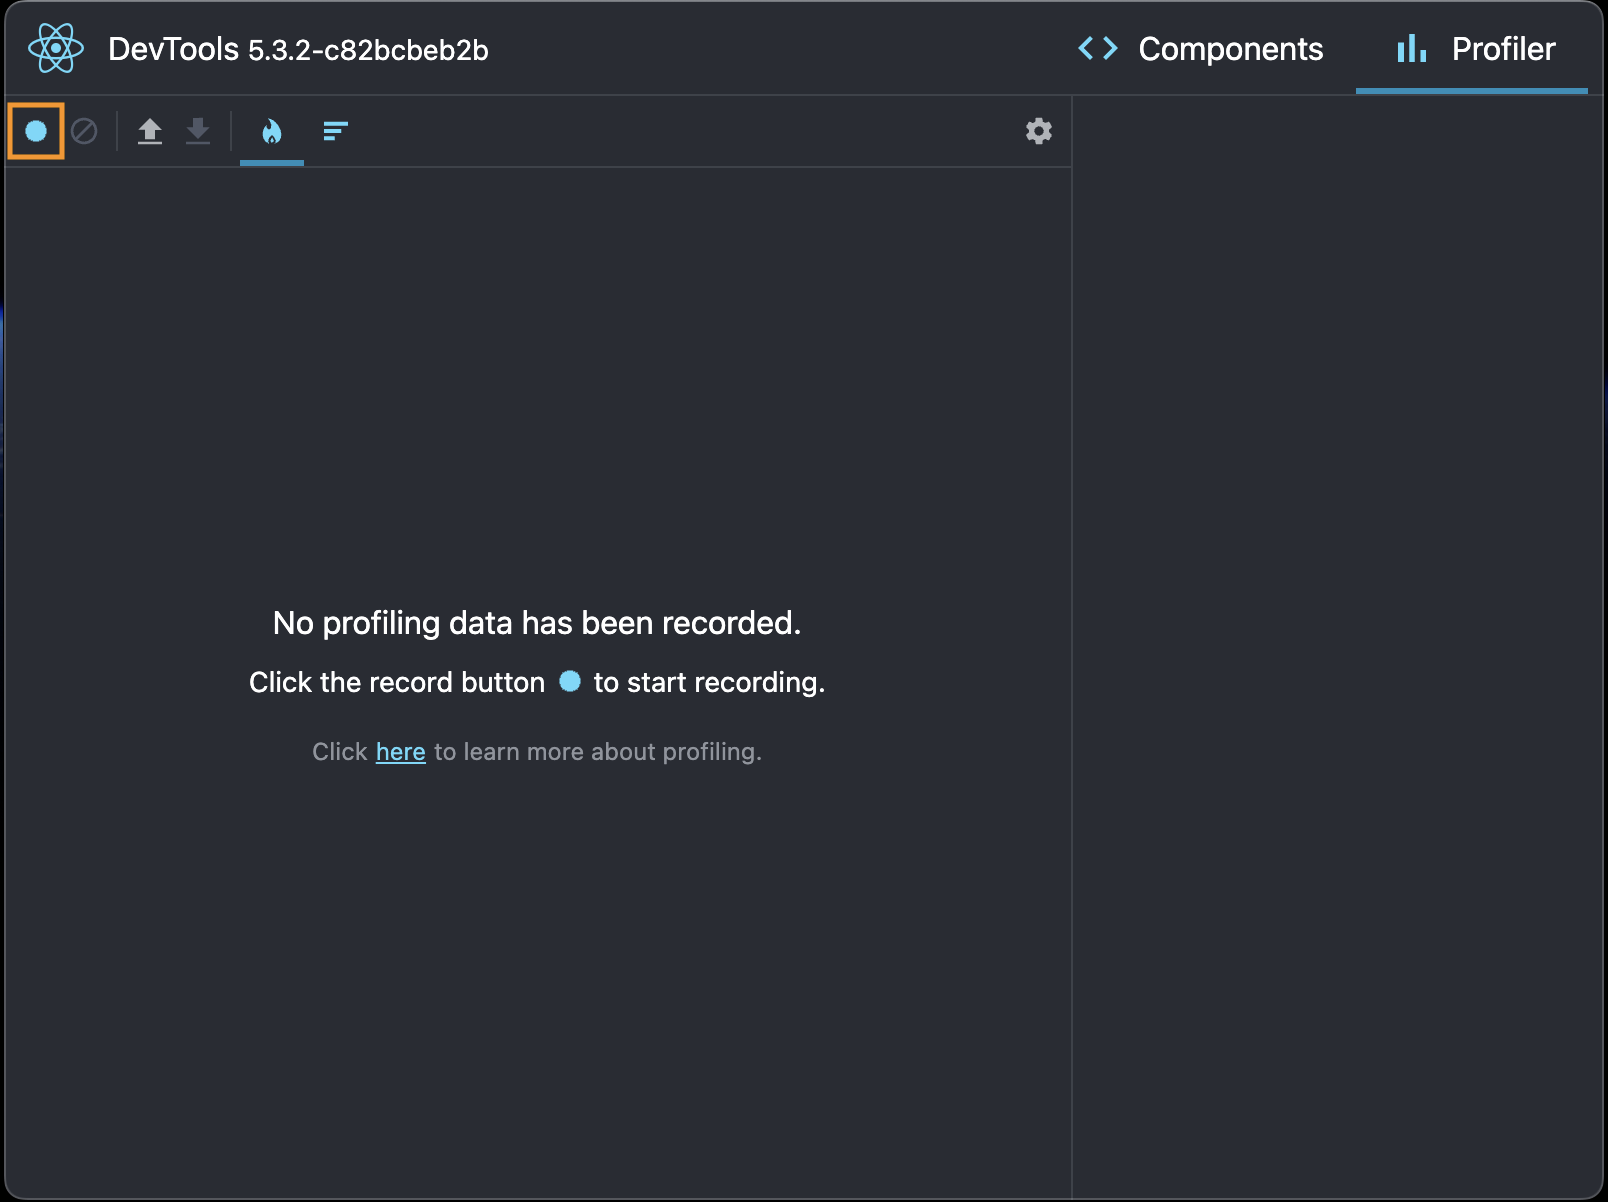
Recording a Profiling Session
Follow these steps to record and analyze a profiling session in React Native:
- Navigate to the Profiler tab in React Native DevTools
- Click the Record button (circular record icon) to start profiling
- Interact with your React Native app to trigger the behavior you want to analyze
- Click Stop to end the recording session and view the profiling results
Understanding React Native Profiler Data
The Profiler provides several views and metrics optimized for React Native:
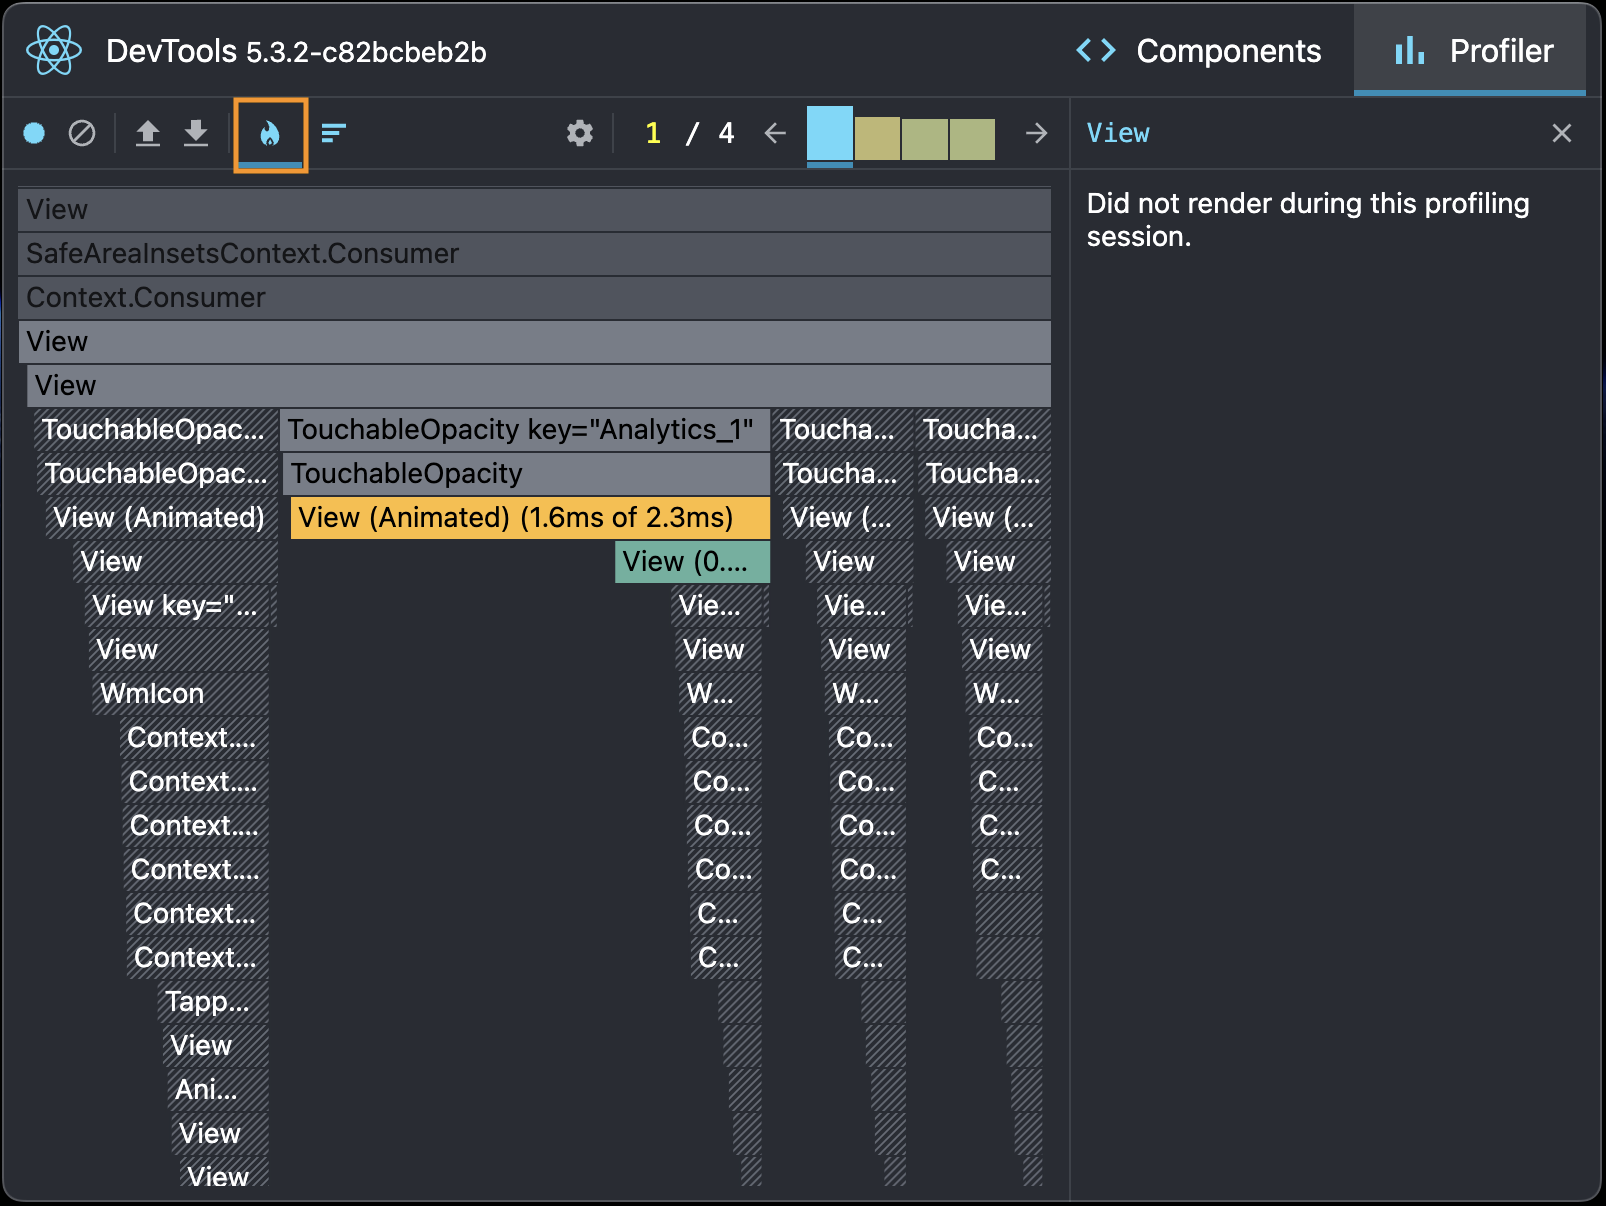
Flamegraph View
- Visual representation of React Native component render times
- Wider bars indicate longer render times
- Color coding shows performance relative to other React Native components
- Identifies bridge communication bottlenecks
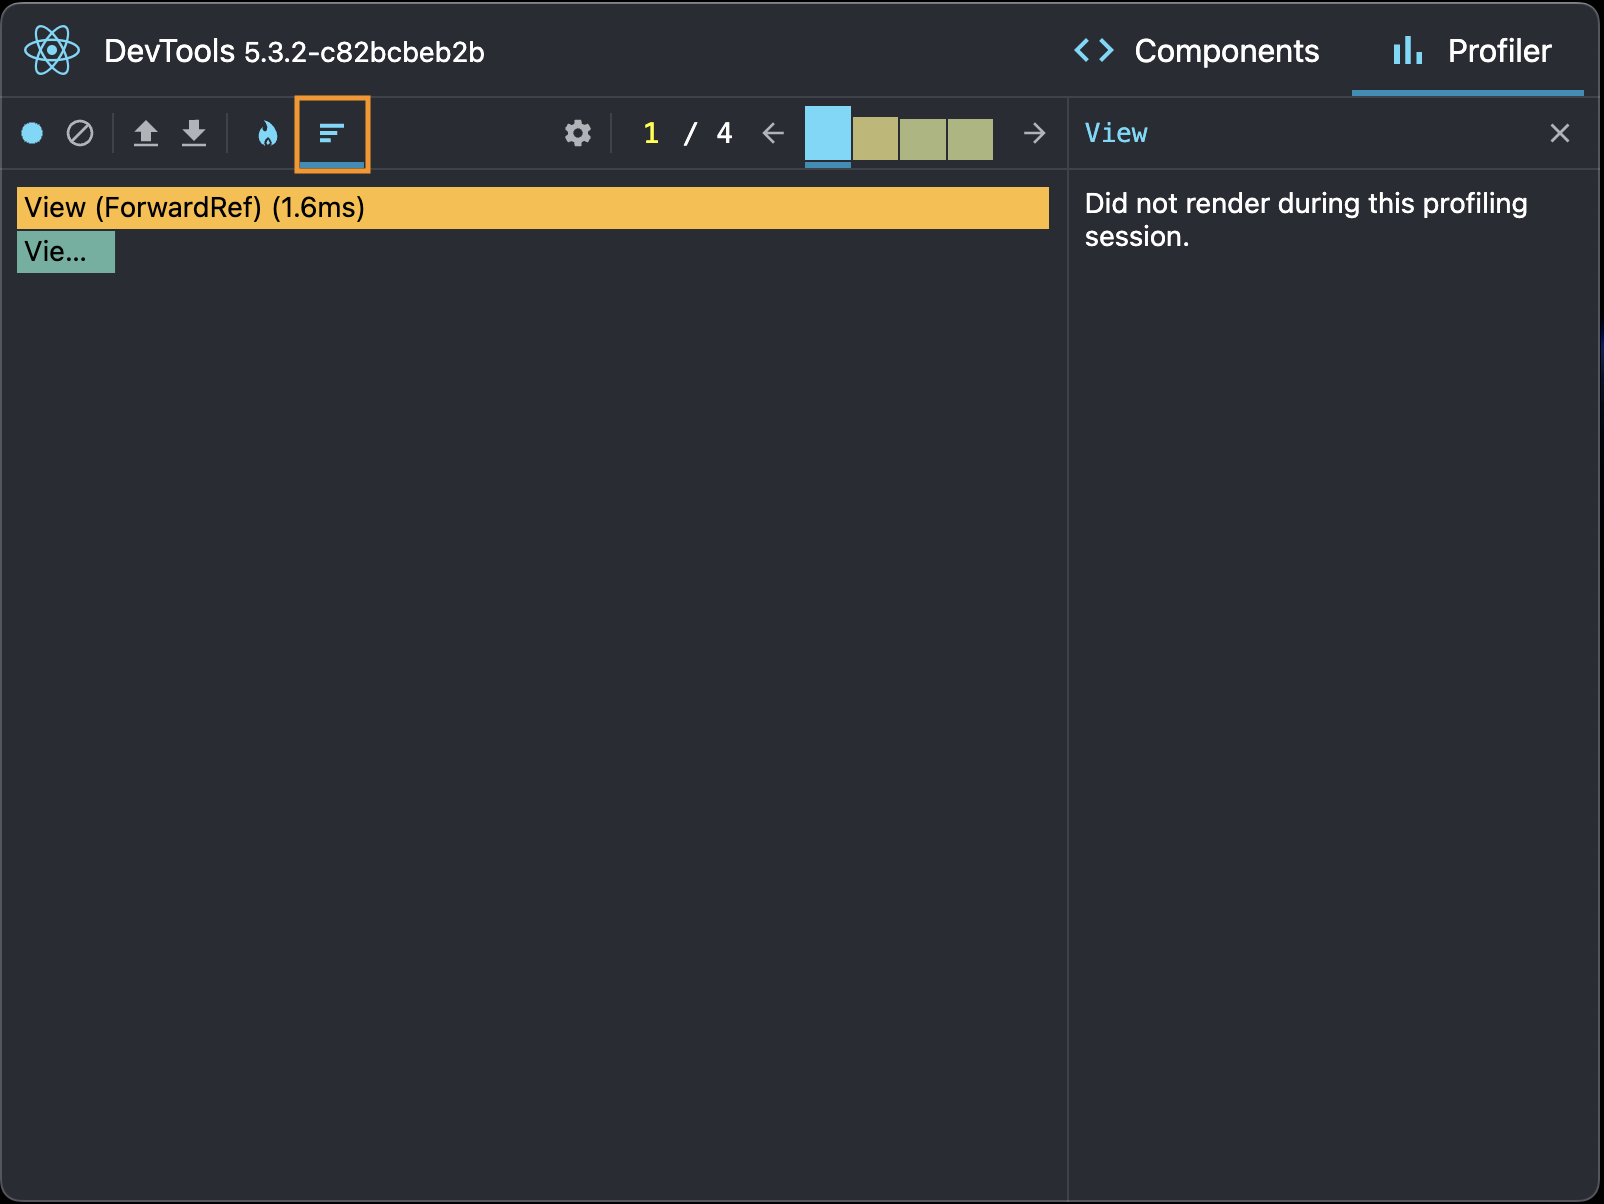
Ranked View
- Lists React Native components ordered by render time
- Identifies the slowest native and JavaScript components for optimization
- Shows actual vs. base render times for React Native elements
Component Chart
- Timeline view of individual React Native component renders
- Shows when components rendered during the session
- Helps identify render frequency patterns specific to mobile interactions

In the above example, you can see that the View rendered 4 times during the profiling session and was expensive, indicating a potential performance optimization opportunity.
Key Metrics for React Native
- Render Duration: Time taken to render each React Native component
- Commit Duration: Time taken to apply changes to the native UI
- Self Time: Time spent in the component itself (excluding children)
- Total Time: Time including all child components
Debugging Common React Native Performance Issues
Identifying Unnecessary Re-renders in React Native
Look for these patterns specific to React Native applications:
- Native components rendering without prop changes
- Frequent renders of expensive native components (like FlatList, Image)
- Deep React Native component trees re-rendering together
- Components with consistent high render times affecting UI thread performance
Recording Why React Native Components Rendered
To understand why React Native components are re-rendering:
- Enable Record why each component rendered while profiling in React Native DevTools settings
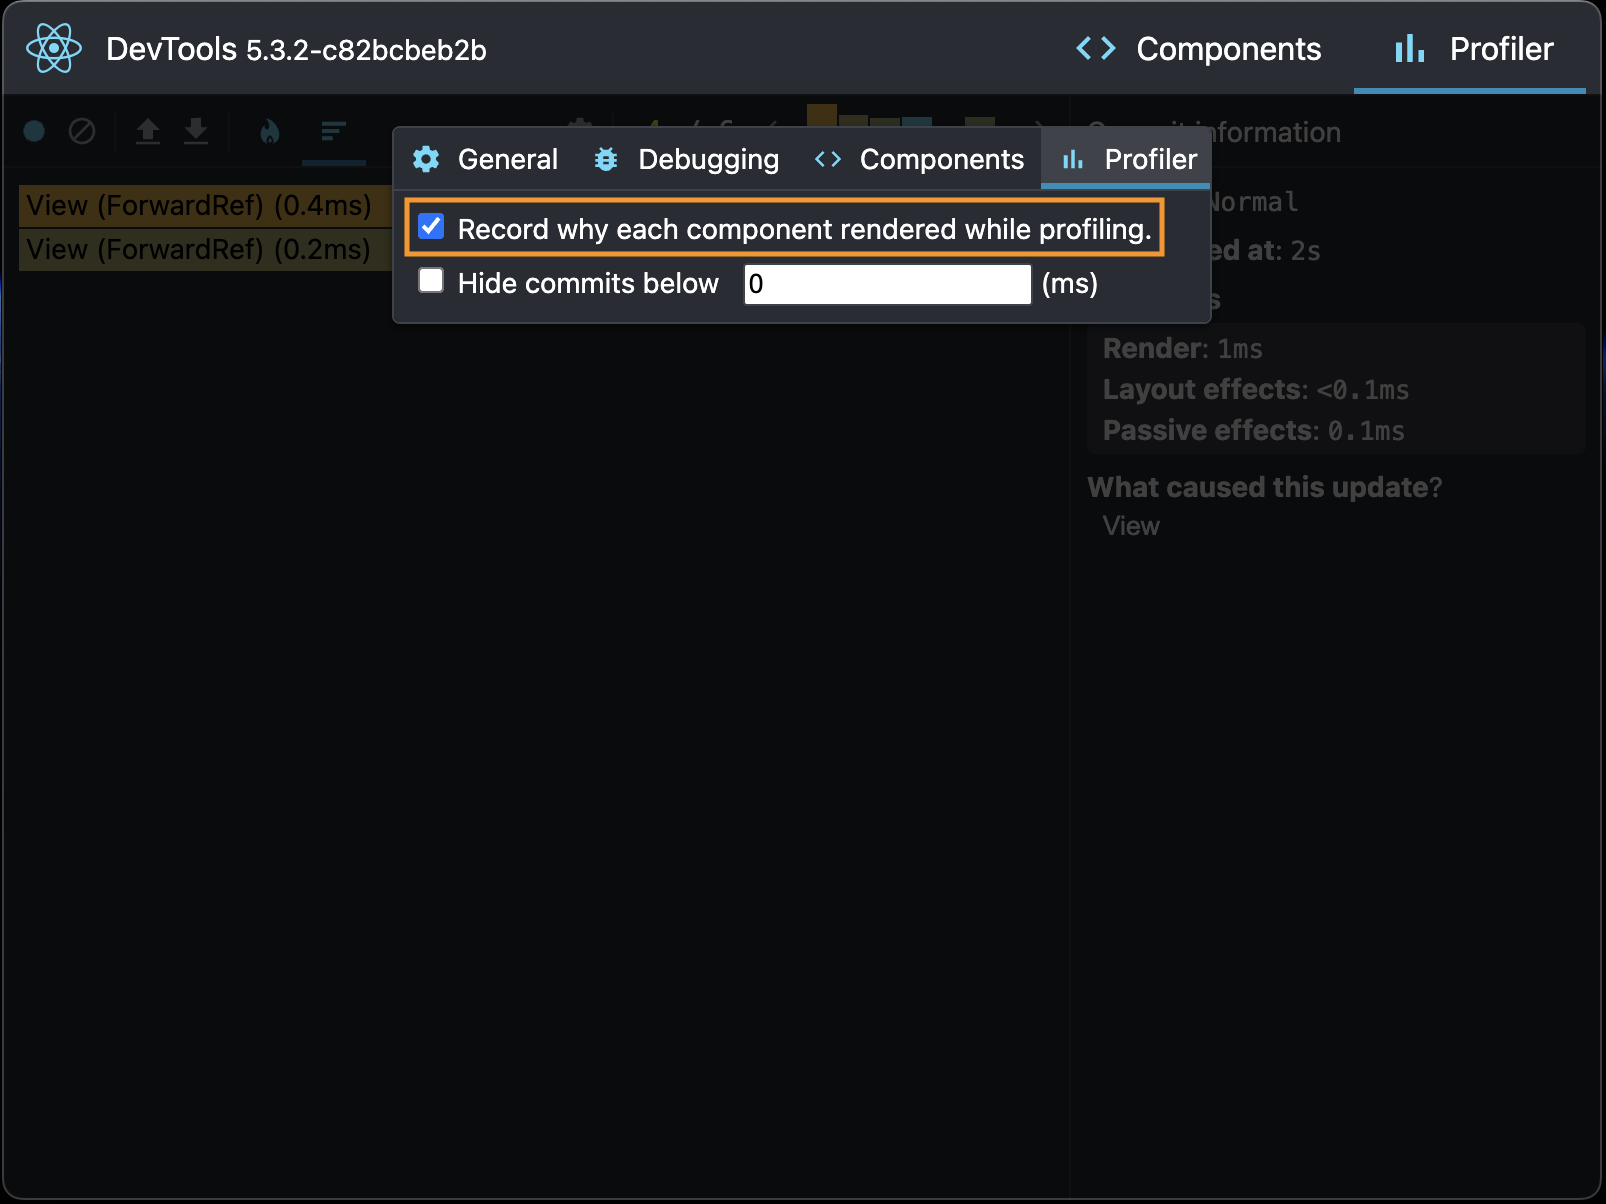
- Record a new profiling session
- Select a React Native component in the profiler
- View the What caused this update? information panel
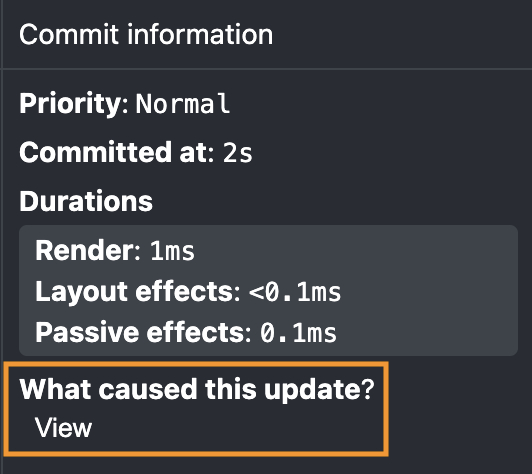
This feature shows:
- Props changes that triggered the re-render in React Native components
- State changes within React Native components
- Parent component re-renders that caused cascading updates in the native UI
Debugging Tips: Using React Native DevTools with Different Setups
Expo Development Build
For Expo apps using development builds:
Start your Expo development build:
Press
jin the terminal to open React Native DevTools
Expo Go
When using Expo Go:
Start your project:
Press
jin the terminal to open React Native DevTools
Standard React Native CLI Projects
For React Native CLI projects (React Native 0.76+):
Start your development server:
Run your app:
Press
jin the terminal to open React Native DevTools
Production Profiling
For production performance analysis:
Expo Projects
Create a production build: