Applying Live Filter to a Data Table or a Chart
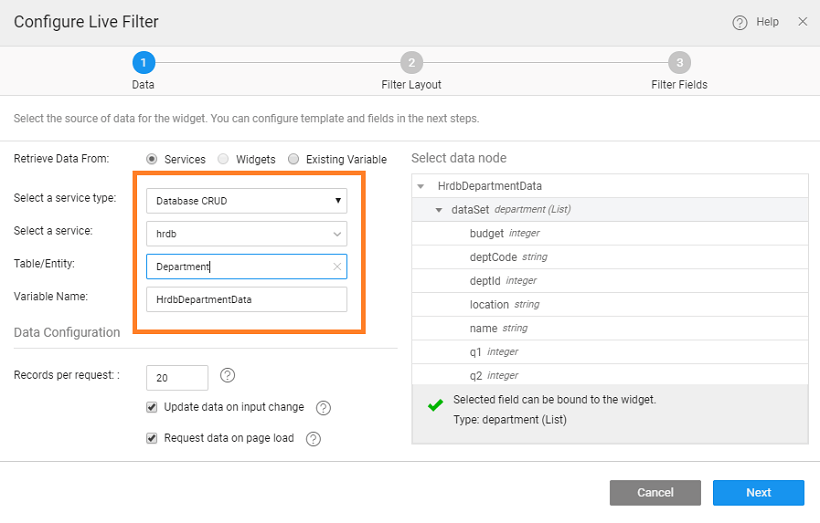
- Drag and drop a filter onto the canvas, setting the Service Type to Database CRUD, using hrdb Service and Department entity. Select Name for the Filter Fields.

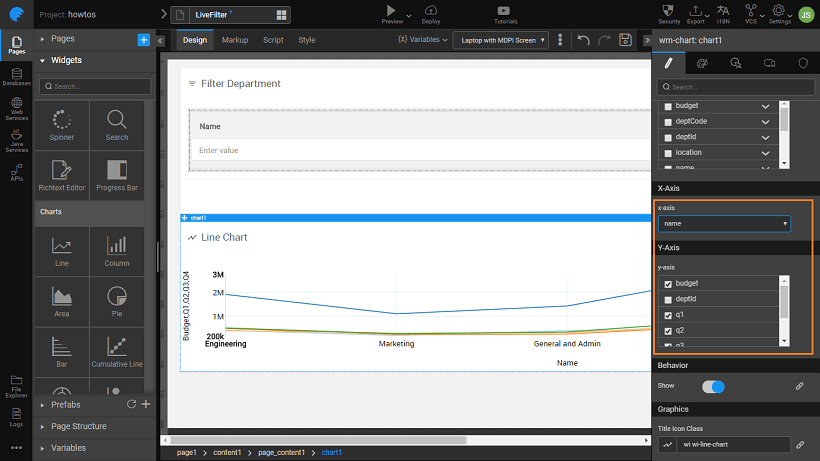
- Drag and drop Data Table or Chart widget on the page.
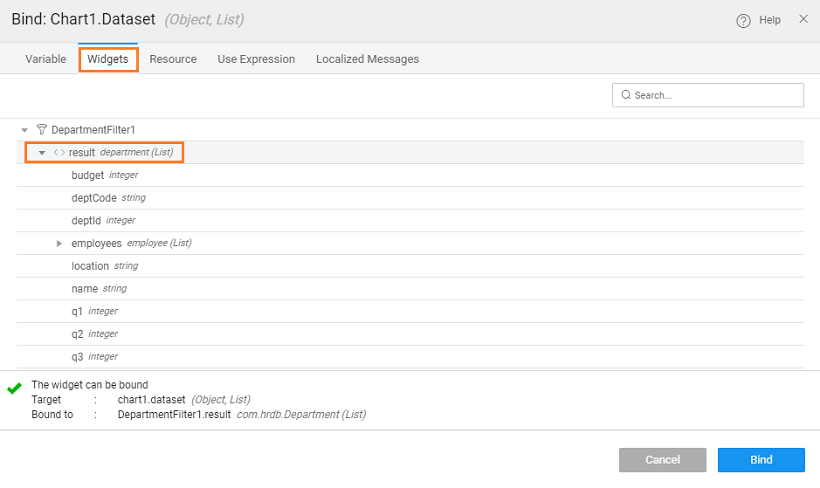
- Bind the widget to the filter created by clicking on the bind icon next to the Value Property in the Dataset section of the Chart widget. In case of Data Table, select Filter Widget as source and the result as the data node.
- Select the Result of the filter you just created from the Widgets tab on the Bind dialog box.

- Select the x-axis and y-axis values for the chart. (in case of Data Table, select the columns to be displayed at the time of configuration or from Advanced Settings)

- Run the application.
- Select a value in the filter and click on Filter button and see the values change in the table/chart.