Version: v10.15

Create Prefab Using D3 Library DataMaps


D3.js is a JavaScript library for producing dynamic, interactive data visualizations in web browsers. It uses widely implemented SVG, HTML5, and CSS standards and it is also known as D3 (Data-Driven Documents).

DataMaps provides data visualizations based on geographical data, and it mainly relies on the D3.js library. DataMaps are designed based on the SVG type; thus, it can scale into any screen size.

In this document, learn how to create a Prefab that displays Datamaps and use it in a project.

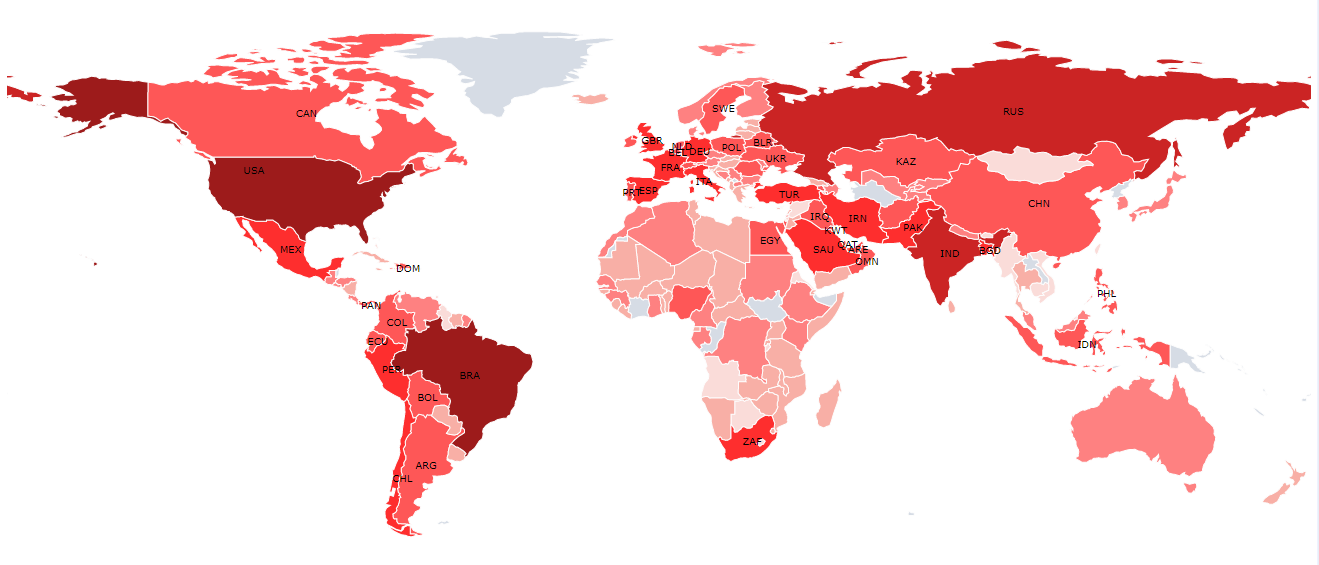
datamap_runbasic

Also, learn how to add some basic properties to edit the functionality. For example, add different colors, show bubbles, labels, and more.

bubbles

Creating DataMaps Prefab

From the Project Dashboard, go to the Prefab tab and click Create.
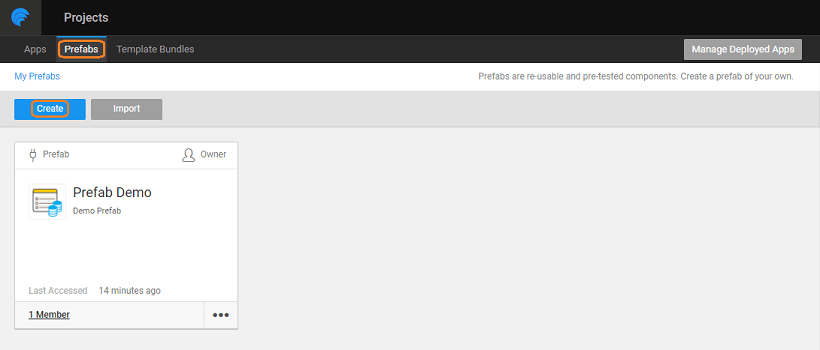
create prefab

Enter a name and description of the Prefab.

Download files

  1. Go to DataMaps website and download the required files from the Downloads section.
info

We have used the following two files - topojson min.js and datamaps world min.js. Extract files from the downloaded-zip files.

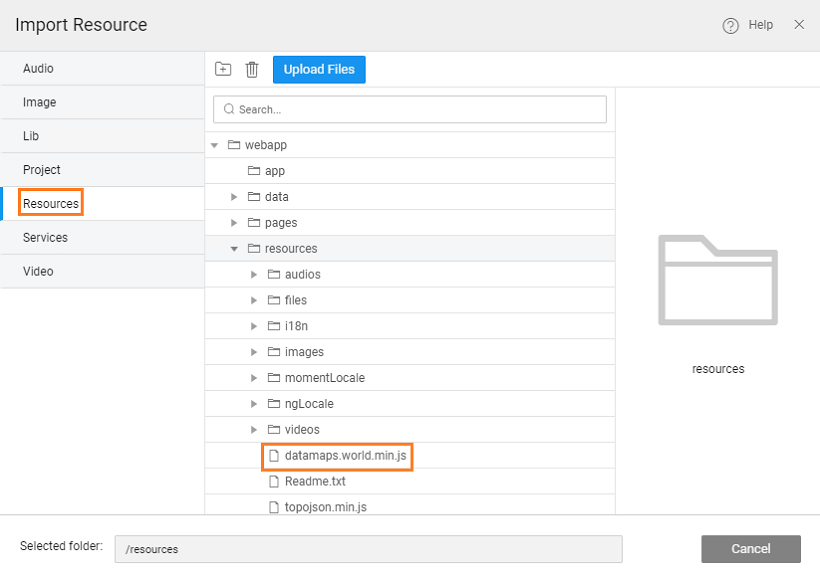
  1. Import the Resources.
  2. Select the folder where you want the resource to import. For this example, select the resources folder and upload the topojson.min.js and datamaps.world.min.js files.

Project Configuration

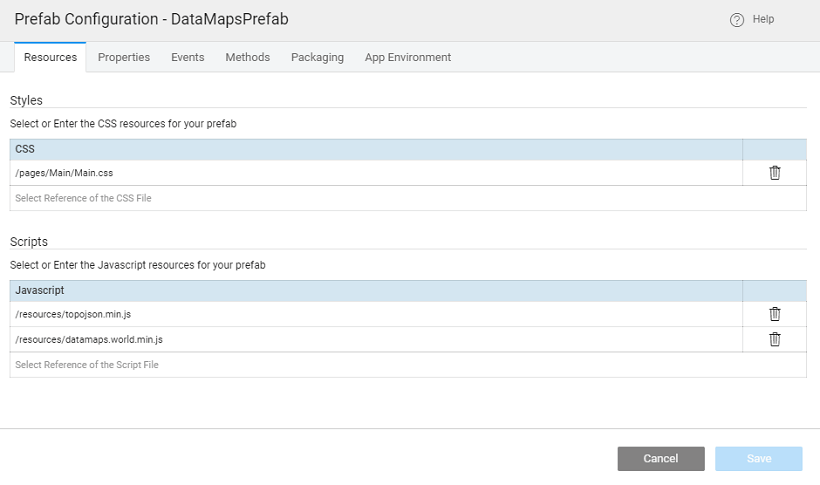
  1. Click Config Prefab from the Settings dropdown.
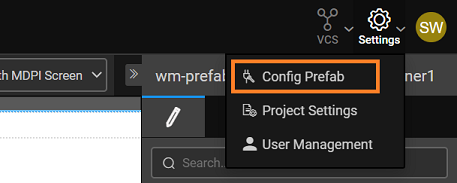
prefab project config

  1. Reference the uploaded javascript files here. Ensure to add topojson first, and then the datamaps resource.

Adding UI Properties

From the Properties tab, set the UI Properties for the Prefab to configure from an app. In this case, you add scope and dataset. For example, scope lets you choose a particular country map, or a world map.
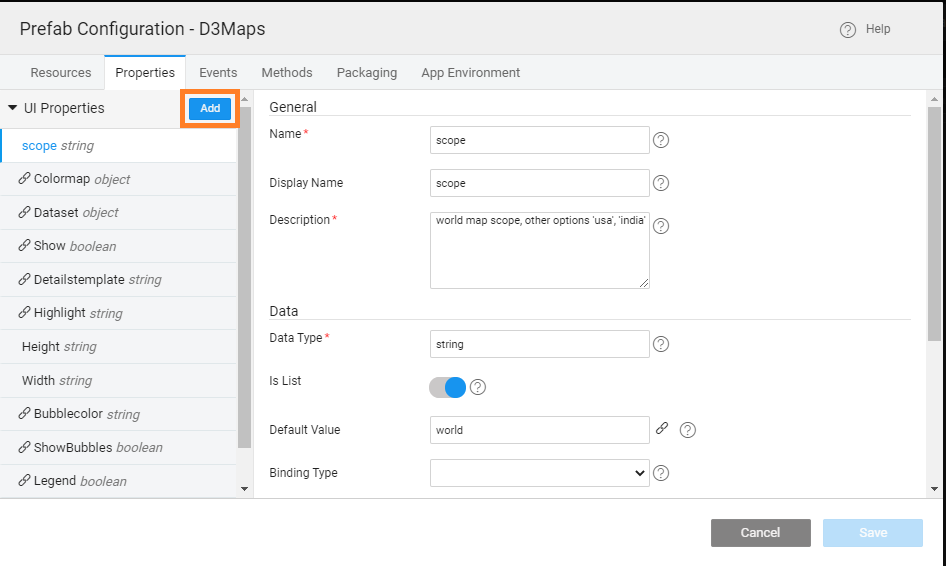
prefab ui properties

Property NameDisplay valueData TypeDefault valueBinding TypeWidget TypeData Options
scopeScopestringWorldSelectWorld, India
datasetDatasetobjectin-boundtext

Designing the UI

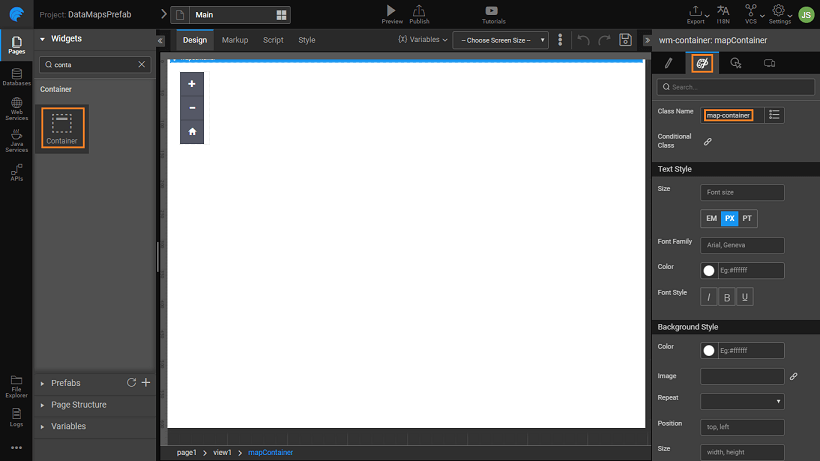
Drag and drop a Container Widget onto the canvas, and provide a Name: mapContainer, and set the Class Name: map-container.

Add Custom Functions

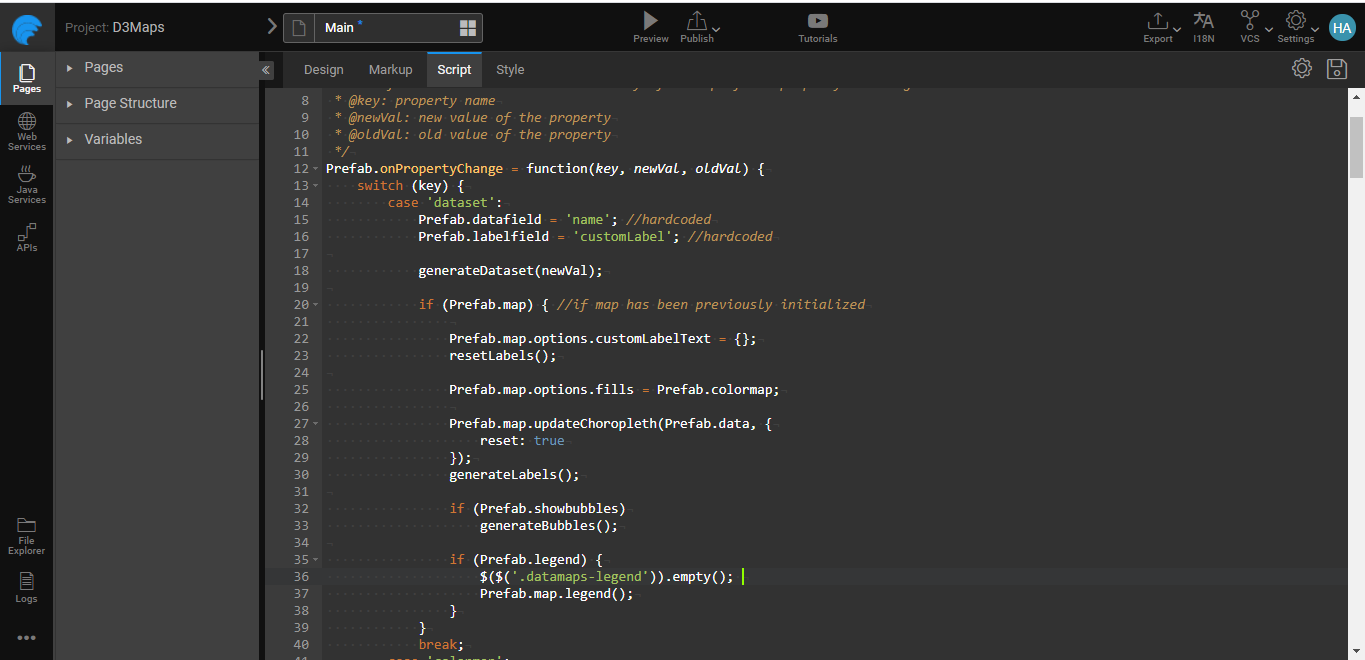
Go to the Script tab, and add the following code.

In this example, we are using the world map and India map. Here, you can choose which map to use based on the scope property of the Prefab.

note

After creating the Prefab, inside the script, you can find a few pre-defined functions.

  • [Prefab.onPropertyChange = propertyChangeHandler;]
  • Prefab.onReady method will be triggered after the initialization of the prefab. The code should go here.
Prefab.onPropertyChange = function(key, newVal, oldVal) {
switch (key) {
case 'dataset':
Prefab.datafield = 'name'; //hardcoded
Prefab.labelfield = 'customLabel'; //hardcoded

generateDataset(newVal);

if (Prefab.map) { //if map has been previously initialized
Prefab.map.options.customLabelText = {};
resetLabels();

Prefab.map.options.fills = Prefab.colormap;
Prefab.map.updateChoropleth(Prefab.data, {
reset: true
});
generateLabels();

if (Prefab.showbubbles)
generateBubbles();

if (Prefab.legend) {
$($('.datamaps-legend')).empty();
Prefab.map.legend();
}
}
break;
case 'colormap':
break;
default:
break;
}
};


Prefab.onReady = function() {
initDataMap();
};

function initDataMap() {
var mapCtr = Prefab.Widgets.mapContainer.$element[0];
// this method will be triggered post initialization of the prefab.
if (Prefab.scope === 'world') {
initWorldMap(mapCtr);
}
// India map
if (Prefab.scope === 'india') {
initIndiaMap(mapCtr);
}

//draw bubbles for bombs
if (Prefab.showbubbles)
generateBubbles();
if (Prefab.legend)
Prefab.map.legend();
}

function initWorldMap(mapCtr) {
Prefab.map = new Datamap({
element: mapCtr,
scope: Prefab.scope,
fills: Prefab.colormap, //Any fill key, HIGH, LOW, MEDIUM, MAJOR, MINOR
//height: Prefab.height,
//width: Prefab.width,
data: Prefab.data,
//customTemplate: Prefab.detailstemplate,
done: function(datamap) {
//datamap.svg.call(d3.behavior.zoom().on("zoom", redrawMap));
Prefab.datamap = datamap;
//Prefab.zoom = d3.behavior.zoom().scaleExtent([1, 8]).on("zoom", zoomed);

// function redrawMap() {
// debugger
// console.log("inside refraw----", d3);
// datamap.svg.selectAll("g").attr("transform", "translate(" + d3.event.translate + ")scale(" + d3.event.scale + ")");
// }
Prefab.datamap = datamap;
},
geographyConfig: {
popupOnHover: Prefab.showdetails,
//highlightOnHover: Prefab.highlight ? true : false,
// highlightFillColor: Prefab.highlight,
highlightBorderColor: Prefab.highlight,
highlightBorderOpacity: 0.5,
popupTemplate: function(geography, data) {
return data["detailstemplate"];
}
},
responsive: true
});

generateLabels();
}

function initIndiaMap(mapCtr) {
Prefab.map = new Datamap({
element: mapCtr,
scope: Prefab.scope,
//height: Prefab.height,
geographyConfig: {
popupOnHover: Prefab.showdetails,
highlightOnHover: true,
borderColor: '#444',
borderWidth: 0.5,
dataUrl: 'https://rawgit.com/Anujarya300/bubble_maps/master/data/geography-data/india.topo.json',
highlightBorderColor: Prefab.highlight,
highlightBorderOpacity: 0.5,
popupTemplate: function(geography, data) {
return data["detailstemplate"];
}
},
fills: Prefab.colormap,
data: Prefab.data,
done: function(datamap) {
},
setProjection: function(element) {
var lat, lon, scaleval;
if (window.matchMedia("screen and (max-width: 480px)").matches) {
lat = 118.9629;
lon = 23.5937;
scaleval = 500;
} else if (window.matchMedia("screen and (max-width: 640px)").matches) {
lat = 96.9629;
lon = 23.5937;
scaleval = 700;
} else if (window.matchMedia("screen and (max-width: 800px)").matches) {
lat = 104.9629;
lon = 23.5937;
scaleval = 650;
} else if (window.matchMedia("screen and (max-width: 1200px)").matches) {
lat = 96.9629;
lon = 23.5937;
scaleval = 750;
} else {
lat = 84.9629;
lon = 23.5937;
scaleval = 1000;
}
var projection = d3.geo.mercator()
.center([lat, lon]) // always in [East Latitude, North Longitude]
.scale(scaleval);
var path = d3.geo.path().projection(projection);
return {
path: path,
projection: projection
};
},
responsive: true
});
generateLabels();
}

//generate dataset for datamap, call on property init()
function generateDataset(dset) {
if (Prefab.scope === 'india') {
Prefab.data = {};
} else {
Prefab.data = [];
}
Prefab.labeldata = {};
if (dset && Prefab.datafield) {
var mainKey = [];
var field = Prefab.datafield.split('.');
var lblfield = Prefab.labelfield.split('.');
_.forEach(dset, function(value, key) {
mainKey = field.length > 1 ? value[field[0]][field[1]] : value[field[0]];
Prefab.data[mainKey] = value;
var labelKey = lblfield.length > 1 ? value[lblfield[0]][lblfield[1]] : value[lblfield[0]];
if (labelKey)
Prefab.labeldata[mainKey] = labelKey;
});
}
}
  • Now, the Prefab should be ready for use.

Publish the Prefab

  1. Save and Publish the Prefab.
  2. You can set the version for the Prefab and Publish it. For more information about publishing Prefabs, see Publish Prefab.
  3. The Prefab will be available for use across the Projects. You can see the entry in the Artefacts list and in the Widget Toolbox of any Project within your workspace.

Using the DataMaps Prefab

  1. Open the project where you want to include the Datamaps Prefab which you created.
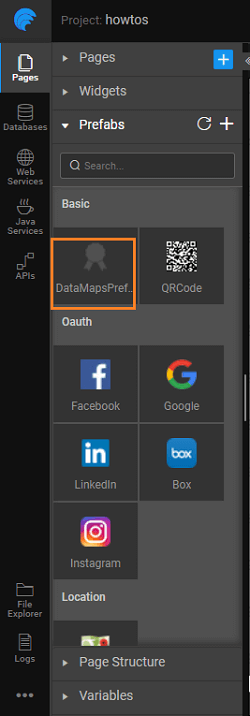
  2. You can find the new Prefab in the Prefabs section.

  1. Drag and drop the Prefab onto the canvas and set the height to auto and width to 100%.
  2. Set the scope as World or India.

Adding the Data

To add the Dataset, create a variable. For example, you can create a CRUD variable, add a Web Service, or create a model variable. For this example, we are using a model variable derived from a web service variable. For more information to add variable, see Variable.

Example data

Data for World map

[
{
"name": "RUS",
"fillKey": "RUS",
"latitude": 61.52401,
"longitude": 105.318756,
"radius": 25,
"customLabel": "2361",
"detailstemplate": "2361$"
},
{
"name": "IND",
"fillKey": "IND",
"latitude": 20.593684,
"longitude": 78.96288,
"radius": 25,
"customLabel": "5456",
"detailstemplate": "5456$"
},
{
"name": "GBR",
"fillKey": "GBR",
"latitude": 55.378051,
"longitude": -3.435973,
"radius": 25,
"customLabel": "123",
"detailstemplate": "4894$"
},
{
"name": "FRA",
"fillKey": "FRA",
"latitude": 46.227638,
"longitude": 2.213749,
"radius": 25,
"customLabel": "145",
"detailstemplate": "4456$"
},
{
"name": "USA",
"fillKey": "USA",
"latitude": 37.09024,
"longitude": -95.712891,
"radius": 25,
"customLabel": "4231",
"detailstemplate": "4231$"
}
]

Data for India Map:

{
"JH":{
"fillKey":"MINOR",
"detailstemplate":"2361$"
},
"MH":{
"fillKey":"MINOR",
"detailstemplate":"5456$"
}
}
note

Do not change the structure of the dataset. Use the above data format.

  1. Run the app and see the map displayed.

datamap_runbasic

Editing or Adding More Functions

Now that we have seen the usage of a basic datamap. Now, let us add some more properties to the Prefab which can add bubble and labels.

These can be bound from the project containing the Prefab.

  1. From the Project Dashboard, go to the Prefab tab and click Create.

  2. Click Config Prefab from the Settings dropdown.

prefab project config

Adding More UI Properties

From the Properties tab, set the UI Properties for the Prefab to configure from an app.

prefab ui properties

NameDisplay ValueData TypeDefault ValueBinding TypeWidget TypeData Options
colormapColor mapobjectin-boundtext
showShowbooleantruein-boundcheckbox
highlightHighlightstring#46C8FFin-boundcolorpicker
heightHeightstringtext
widthWidthstringtext
bubblecolorBubblecolorstring#ffc0cbin-boundtext
showbubblesShowbubblesbooleanfalsein-boundtext
legendLegendbooleanfalsein-boundtext

Additional Custom Functions

Go to the Script tab, and add the following lines code which adds new functions; these functions were referenced in the example-code above. It adds additional ability to display the label and bubbles on the Datamaps Prefab.

function resetLabels() {
var stdLabelKeys = {};
if (Prefab.scope === 'india') {
stdLabelKeys = _.keys(Prefab.Variables.indiaStateCodes.dataSet);
} else {
stdLabelKeys = Prefab.datamap.worldTopo.objects.world.geometries;
}

var labels = {};
_.forEach(stdLabelKeys, function(value) {
var key = (Prefab.scope === 'india') ? value : value.id;
labels[key] = ' ';
});
Prefab.map.labels({
'customLabelText': labels
});
$($('.labels')).empty();

//generates custom labels for countries
function generateLabels() {
var stdLabelKeys = {};
if (Prefab.scope === 'india') {
stdLabelKeys = _.keys(Prefab.Variables.indiaStateCodes.dataSet);
} else {
stdLabelKeys = Prefab.datamap.worldTopo.objects.world.geometries;
}

if (Prefab.labeldata) {
var countryList = {},
labelKeys = [];
//get all keys from the label data
_.forEach(Prefab.labeldata, function(value, key) {
labelKeys.push(key);
});
//get all countries to prepare the list of key and value for labels
_.forEach(stdLabelKeys, function(value) {
var key = (Prefab.scope === 'india') ? value : value.id;
_.includes(labelKeys, key) ? countryList[key] = key : countryList[key] = ' ';
});
Prefab.map.labels({
'customLabelText': countryList
});
}
}

function generateBubbles() {
if (Prefab.scope === 'india' && Prefab.dataset) {
const bubblearray = [];
_.forEach(Prefab.dataset, function(obj) {
bubblearray.push(obj);
});

Prefab.map.bubbles(bubblearray, {
popupOnHover: true,
highlightOnHover: Prefab.bubblecolor ? true : false,
highlightFillColor: Prefab.bubblecolor,
highlightBorderColor: Prefab.bubblecolor,
highlightBorderOpacity: 0.4,
popupTemplate: function(geo, data) {
return data["detailstemplate"];
}
});
} else {
Prefab.map.bubbles(Prefab.dataset, {
popupOnHover: true,
highlightOnHover: Prefab.bubblecolor ? true : false,
highlightFillColor: Prefab.bubblecolor,
highlightBorderColor: Prefab.bubblecolor,
highlightBorderOpacity: 0.3,
popupTemplate: function(geo, data) {
return data["detailstemplate"];
}
});
}
}

Save and Publish

Save and publish the prefab. Now, the Prefab is ready for use with additional functionalities.

Using Prefab with Additional Functionality

Now that you have made changes to the Prefab, we have to include these changes in the Project using the Prefab. There are two ways to achieve this.

  1. Update in Prefab in Project
  2. Publish Prefab with an updated version

Update Prefab in Project

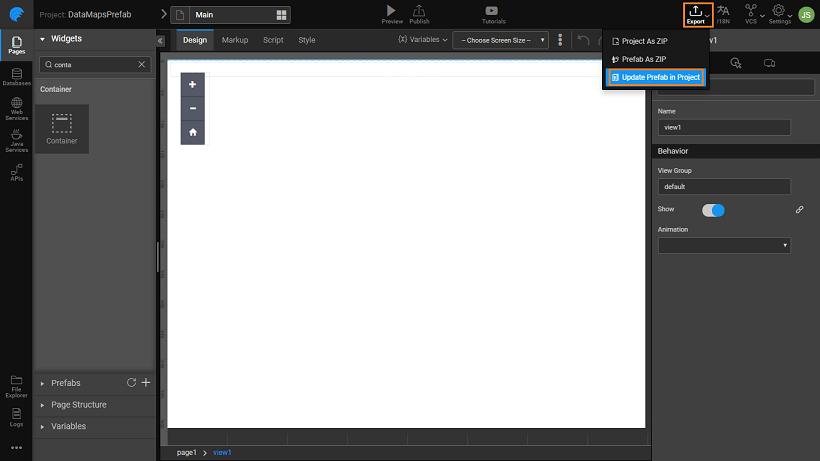
  1. From the Prefab, select Update Prefab in Project under the Export option and select the Project using the Prefab.

  1. Open the Project where Prefab was incorporated earlier.
  2. You will see a dialog saying the updated version is available for usage. You can choose to Revert to the published version or Continue with the updated version. Click Continue to see the updated version.
  3. You will see the Prefab in the Toolbox with MOD status indicating that it is the modified version.
  4. You need to Publish the Prefab to get the updated version in the Artifacts.

Publish Prefab

  1. Publish the Prefab and increment the version number.
  2. Open the Project where Prefab was incorporated earlier.
  3. You will see a dialog saying the updated version is available for use. Thus, Update and Reload.

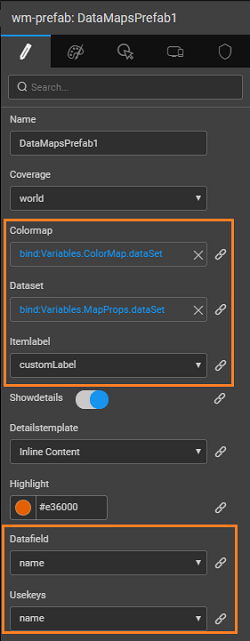
You will find new properties displayed in the Properties panel.

Adding New Variable

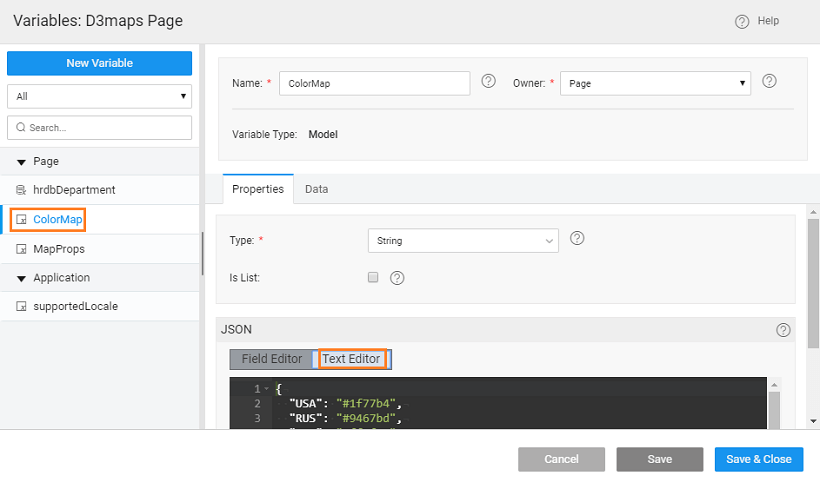
To set the colormap property, we will be using a Model Variables for ColorMap. As an example you can use the following.

Colormap Variable

Data for the World map

{
"USA": "#1f77b4",
"RUS": "#9467bd",
"IND": "#e377c2",
"GBR": "#8c564b",
"FRA": "#d62728",
"defaultFill": "#EDDC4E"
}

Data for India map

{
"LOW": "FADCD9",
"MINOR": "#F8AFA6",
"MODERATE": "#FE8181",
"HIGH": "#FE5757",
"SEVERE": "#FE2E2E",
"CRITICAL": "#CB2424",
"defaultFill": "#dddddd"
}

  • Bind ColorMaps Variable to the Colormap Property.
  • Set ShowBubbles property to true.

Run the app, you can see the countries color-coded, along with the labels and bubbles.

bubbles

See Also

Prefab to compare two strings
Prefab using 3rd Party UI Widgets
Prefab Using D3 & NVD3 Charts
Prefab Using JQuery Plugin - showcases using Events and Methods