Create Prefab Using D3 Library DataMaps
D3.js is a JavaScript library for producing dynamic, interactive data visualizations in web browsers. It uses widely implemented SVG, HTML5, and CSS standards and it is also known as D3 (Data-Driven Documents).
DataMaps provides data visualizations based on geographical data, and it mainly relies on the D3.js library. DataMaps are designed based on the SVG type; thus, it can scale into any screen size.
In this document, learn how to create a Prefab that displays Datamaps and use it in a project.
Also, learn how to add some basic properties to edit the functionality. For example, add different colors, show bubbles, labels, and more.
![]()
Creating DataMaps Prefab
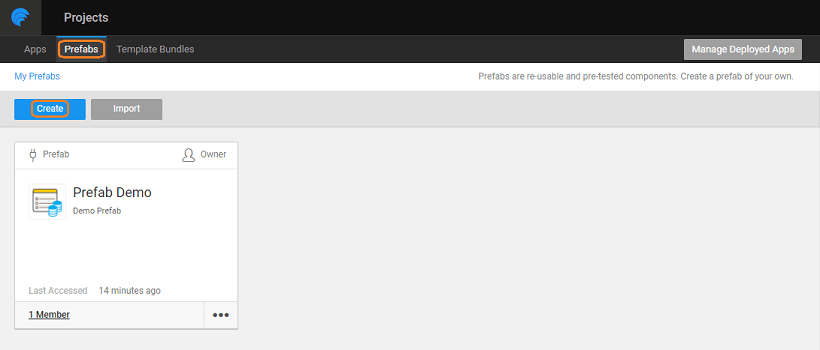
From the Project Dashboard, go to the Prefab tab and click Create.
Enter a name and description of the Prefab.
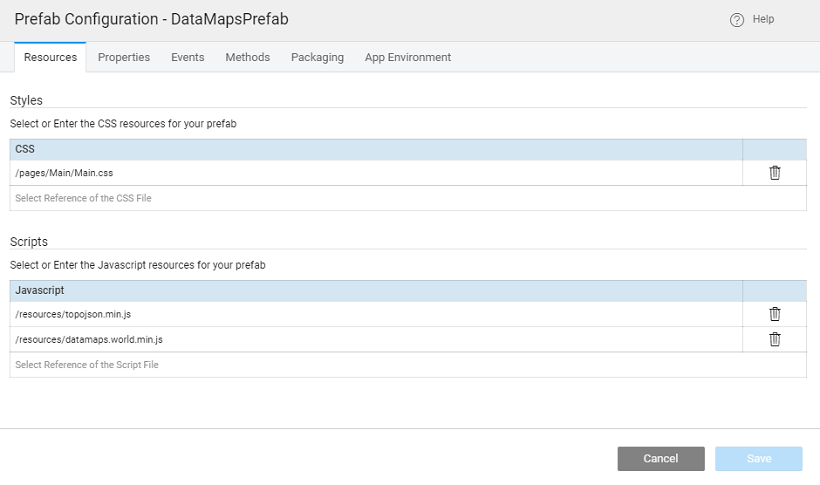
Download files
- Go to DataMaps website and download the required files from the Downloads section.
We have used the following two files - topojson min.js and datamaps world min.js. Extract files from the downloaded-zip files.
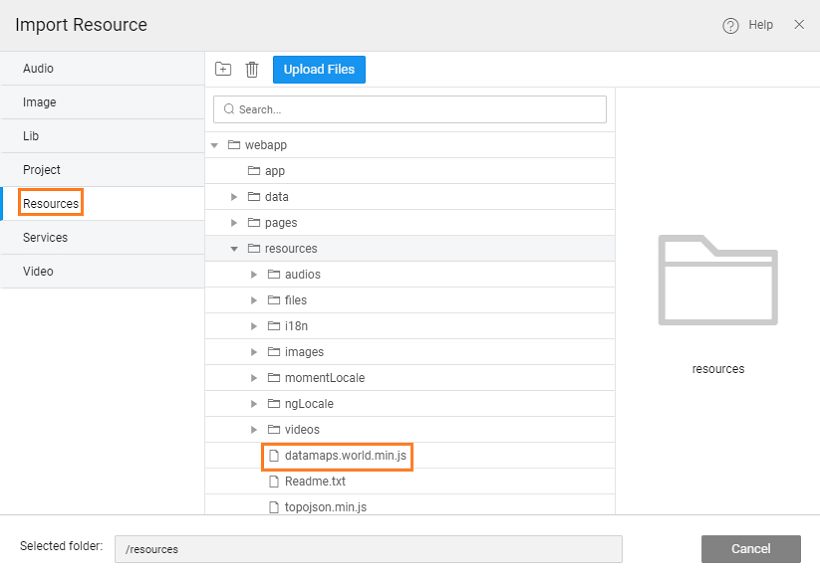
- Import the Resources.
- Select the folder where you want the resource to import. For this example, select the
resourcesfolder and upload thetopojson.min.jsanddatamaps.world.min.jsfiles.
Project Configuration
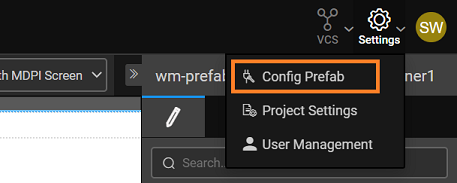
- Click Config Prefab from the Settings dropdown.
- Reference the uploaded javascript files here. Ensure to add
topojsonfirst, and then thedatamapsresource.
Adding UI Properties
From the Properties tab, set the UI Properties for the Prefab to configure from an app. In this case, you add scope and dataset. For example, scope lets you choose a particular country map, or a world map.
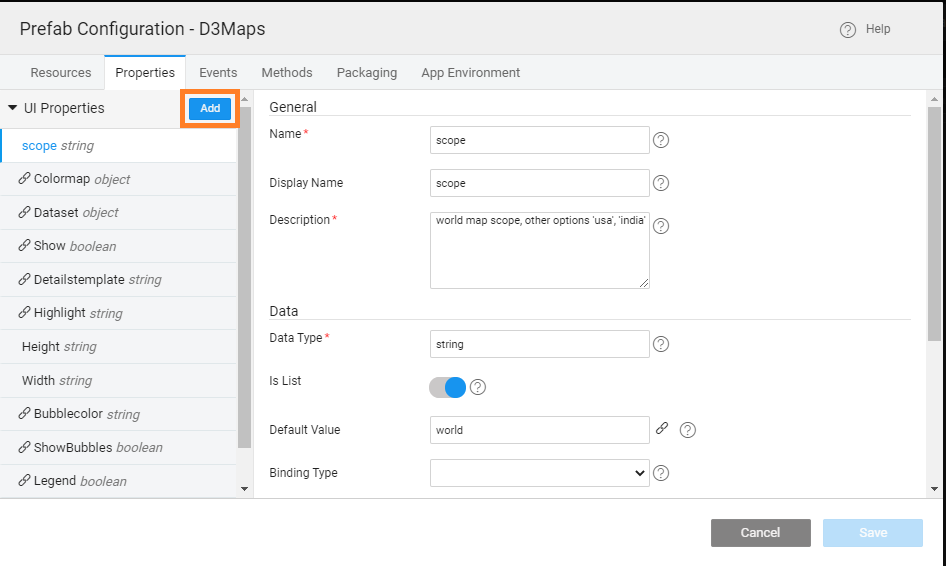
| Property Name | Display value | Data Type | Default value | Binding Type | Widget Type | Data Options |
|---|---|---|---|---|---|---|
| scope | Scope | string | World | Select | World, India | |
| dataset | Dataset | object | in-bound | text |
Designing the UI
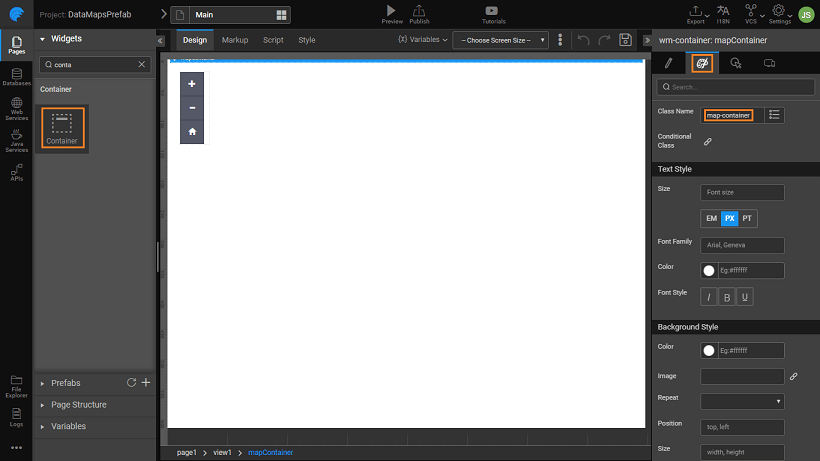
Drag and drop a Container Widget onto the canvas, and provide a Name: mapContainer, and set the Class Name: map-container.
Add Custom Functions
Go to the Script tab, and add the following code.
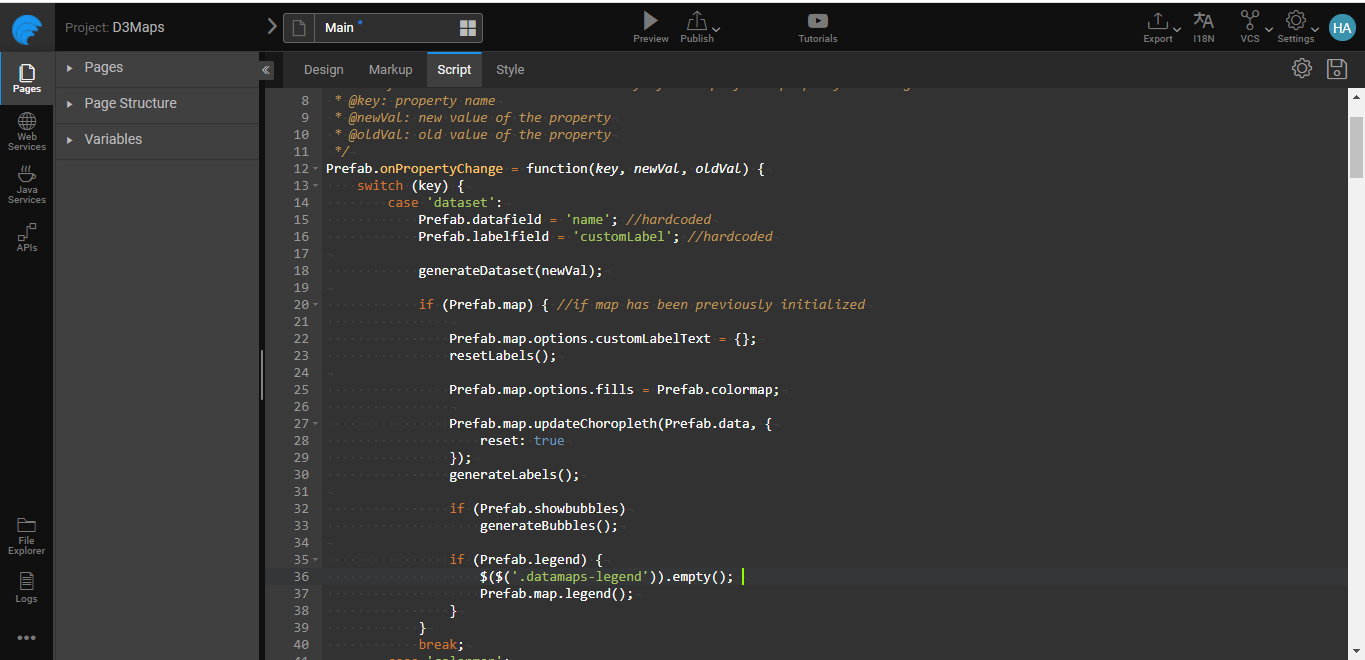
In this example, we are using the world map and India map. Here, you can choose which map to use based on the scope property of the Prefab.
After creating the Prefab, inside the script, you can find a few pre-defined functions.
[Prefab.onPropertyChange = propertyChangeHandler;]Prefab.onReadymethod will be triggered after the initialization of the prefab. The code should go here.
- Now, the Prefab should be ready for use.
Publish the Prefab
- Save and Publish the Prefab.
- You can set the version for the Prefab and Publish it. For more information about publishing Prefabs, see Publish Prefab.
- The Prefab will be available for use across the Projects. You can see the entry in the Artefacts list and in the Widget Toolbox of any Project within your workspace.
Using the DataMaps Prefab
- Open the project where you want to include the Datamaps Prefab which you created.
- You can find the new Prefab in the Prefabs section.
- Drag and drop the Prefab onto the canvas and set the height to auto and width to 100%.
- Set the scope as World or India.
Adding the Data
To add the Dataset, create a variable. For example, you can create a CRUD variable, add a Web Service, or create a model variable. For this example, we are using a model variable derived from a web service variable. For more information to add variable, see Variable.
Example data
Data for World map
Data for India Map:
Do not change the structure of the dataset. Use the above data format.
- Run the app and see the map displayed.
Editing or Adding More Functions
Now that we have seen the usage of a basic datamap. Now, let us add some more properties to the Prefab which can add bubble and labels.
These can be bound from the project containing the Prefab.
From the Project Dashboard, go to the Prefab tab and click Create.
Click Config Prefab from the Settings dropdown.
Adding More UI Properties
From the Properties tab, set the UI Properties for the Prefab to configure from an app.
| Name | Display Value | Data Type | Default Value | Binding Type | Widget Type | Data Options |
|---|---|---|---|---|---|---|
| colormap | Color map | object | in-bound | text | ||
| show | Show | boolean | true | in-bound | checkbox | |
| highlight | Highlight | string | #46C8FF | in-bound | colorpicker | |
| height | Height | string | text | |||
| width | Width | string | text | |||
| bubblecolor | Bubblecolor | string | #ffc0cb | in-bound | text | |
| showbubbles | Showbubbles | boolean | false | in-bound | text | |
| legend | Legend | boolean | false | in-bound | text |
Additional Custom Functions
Go to the Script tab, and add the following lines code which adds new functions; these functions were referenced in the example-code above. It adds additional ability to display the label and bubbles on the Datamaps Prefab.
Save and Publish
Save and publish the prefab. Now, the Prefab is ready for use with additional functionalities.
Using Prefab with Additional Functionality
Now that you have made changes to the Prefab, we have to include these changes in the Project using the Prefab. There are two ways to achieve this.
- Update in Prefab in Project
- Publish Prefab with an updated version
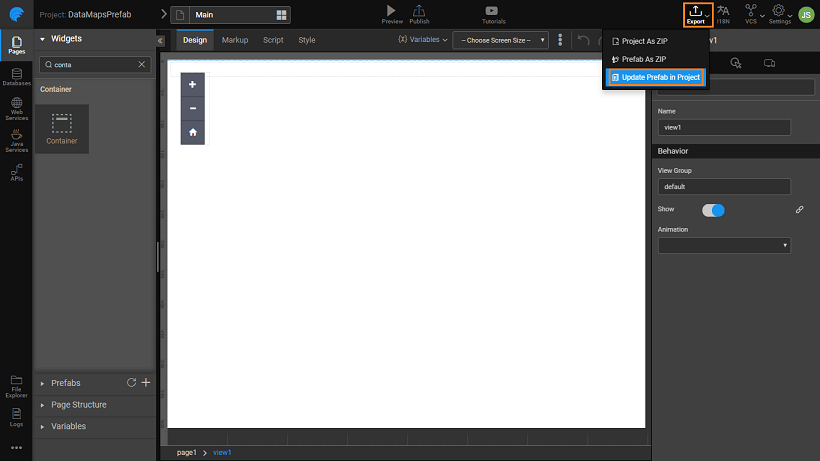
Update Prefab in Project
- From the Prefab, select Update Prefab in Project under the Export option and select the Project using the Prefab.
- Open the Project where Prefab was incorporated earlier.
- You will see a dialog saying the updated version is available for usage. You can choose to Revert to the published version or Continue with the updated version. Click Continue to see the updated version.
- You will see the Prefab in the Toolbox with MOD status indicating that it is the modified version.
- You need to Publish the Prefab to get the updated version in the Artifacts.
Publish Prefab
- Publish the Prefab and increment the version number.
- Open the Project where Prefab was incorporated earlier.
- You will see a dialog saying the updated version is available for use. Thus, Update and Reload.
You will find new properties displayed in the Properties panel.
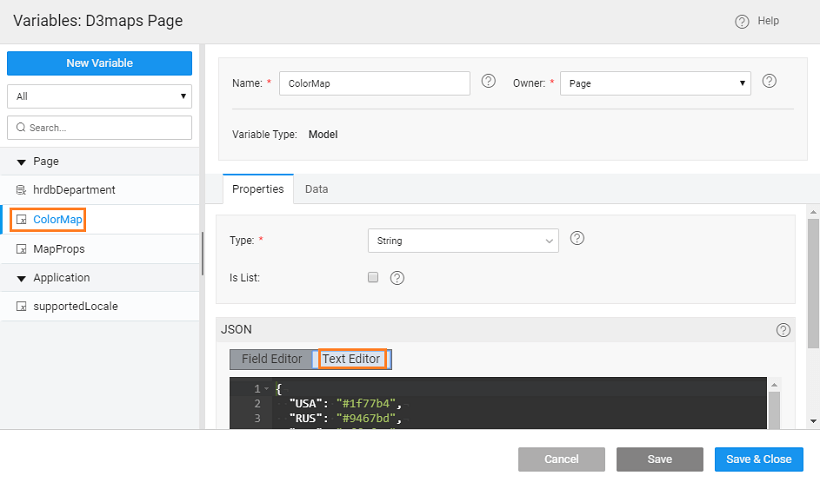
Adding New Variable
To set the colormap property, we will be using a Model Variables for ColorMap. As an example you can use the following.
Colormap Variable
Data for the World map
Data for India map
- Bind ColorMaps Variable to the Colormap Property.
- Set ShowBubbles property to true.
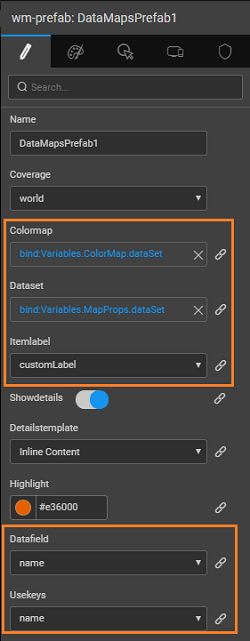
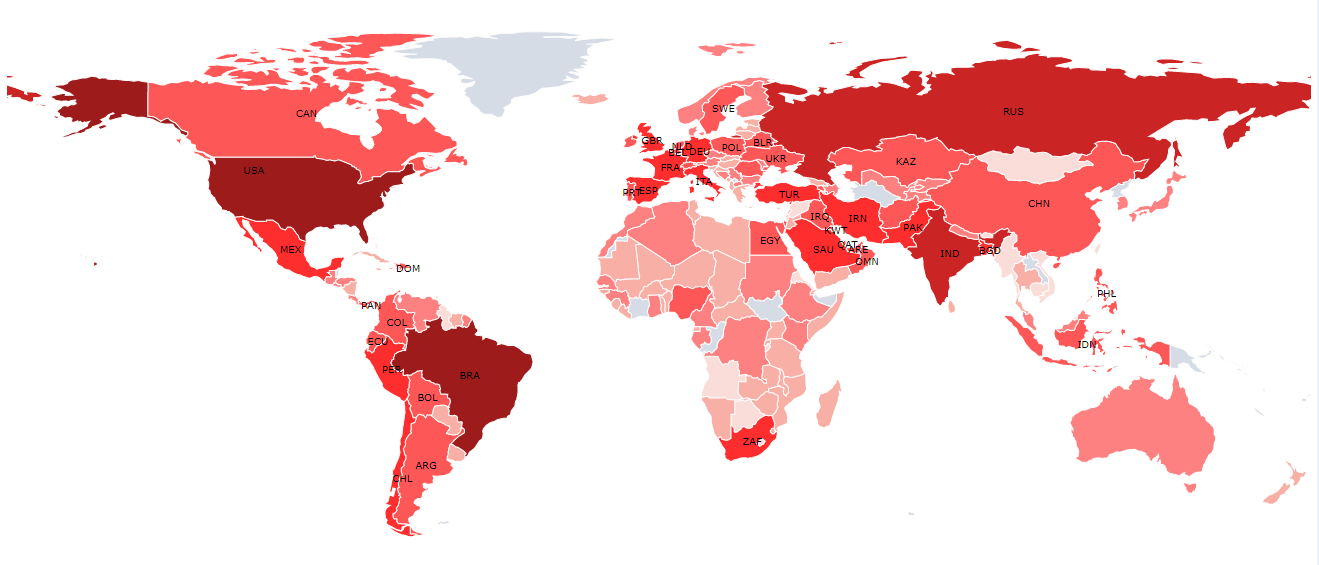
Run the app, you can see the countries color-coded, along with the labels and bubbles.
![]()
See Also
Prefab to compare two strings
Prefab using 3rd Party UI Widgets
Prefab Using D3 & NVD3 Charts
Prefab Using JQuery Plugin - showcases using Events and Methods