Create Prefab Using D3 & NVD3 Charts
D3 allows you to bind arbitrary data to a Document Object Model (DOM), and then apply data-driven transformations to the document. For example, you can use D3 to generate an HTML table from an array of numbers. Or, use the same data to create an interactive SVG bar chart with smooth transitions and interaction. The chart widgets which are offered by WaveMaker are based out of NVD3 charts, which are re-usable charts for D3 charts. and as such implementing any of the NVD3 & D3 charts becomes easy. Here we will see two simple examples - line chart (D3) and line plus bar chart (NVD3).
Implementing D3 Charts
We will see the implementation of a simple d3 line chart using the following example.
This implementation is for D3 version: 3.5.17 charts.
Click on Create from the Prefab tab of the Project Dashboard
Enter a name and description for the Prefab
SAVE the project setting without making any changes
Open the SCRIPT tab of the Main page
- Add a variable
var data = []; - Add the following code to the propertyChangeHandler function. This code is taking the input data in the form of an object and generating the values to be represented on the sale- and year- attributes for the chart. The input object, according to the below code snippet, is expected to have at least two fields named budget and year. We are using this since in implementation we will show binding the chart to Department database.
- Enter the following code (you can copy and paste the same). This code is to set up the visual rendering of D3 chart.
- Invoke the above function when Prefab loads:
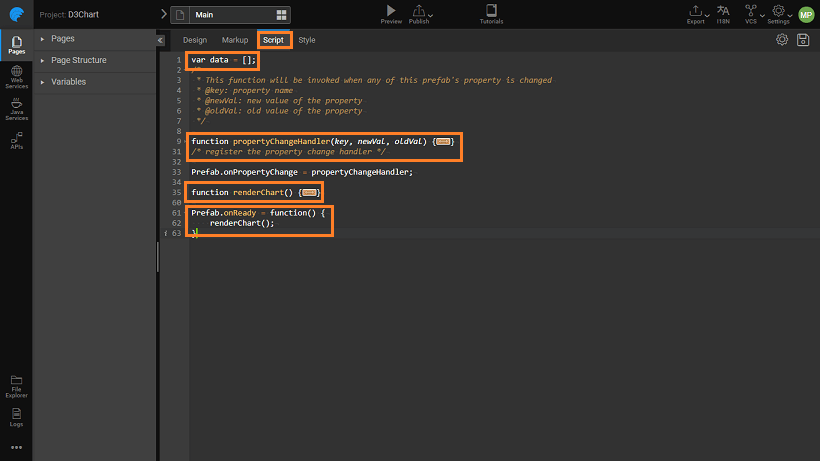
- Add a variable
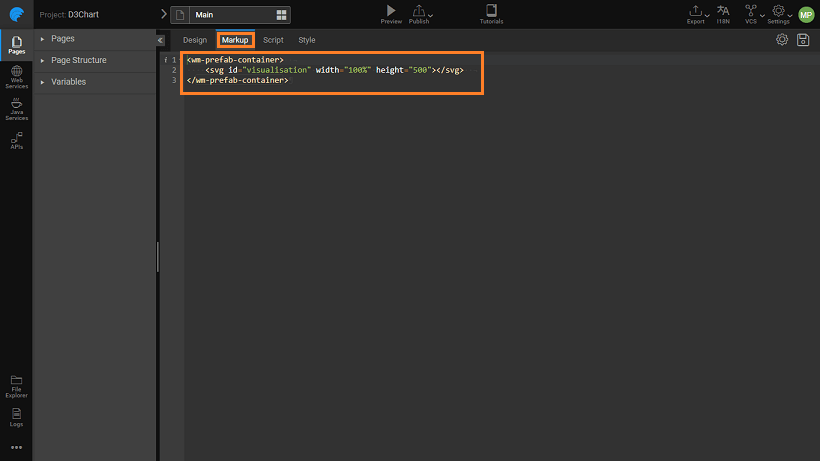
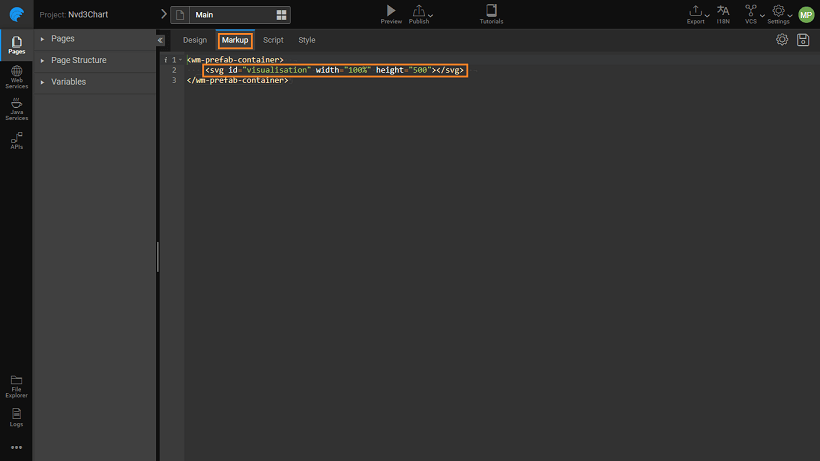
In the MARKUP tab add the following code within the wm-content tag:
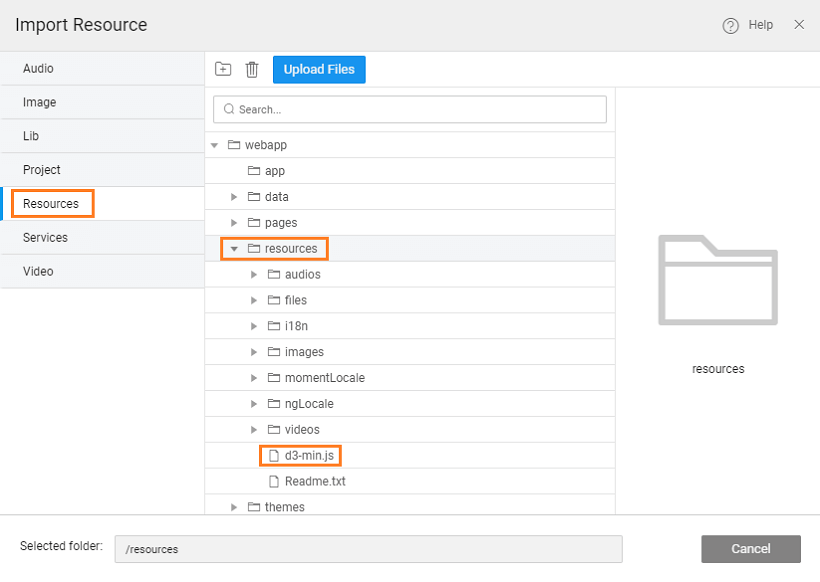
Import Resource, to import the d3-min js file (download and extract the file) into the Resource folder of your Prefab.


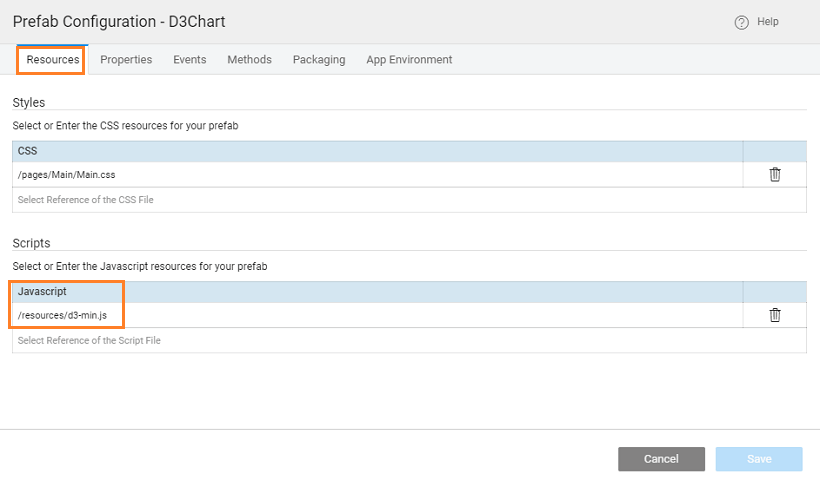
From Project Configurations, choose Config Prefab under Settings:
- From Resources, add the js files

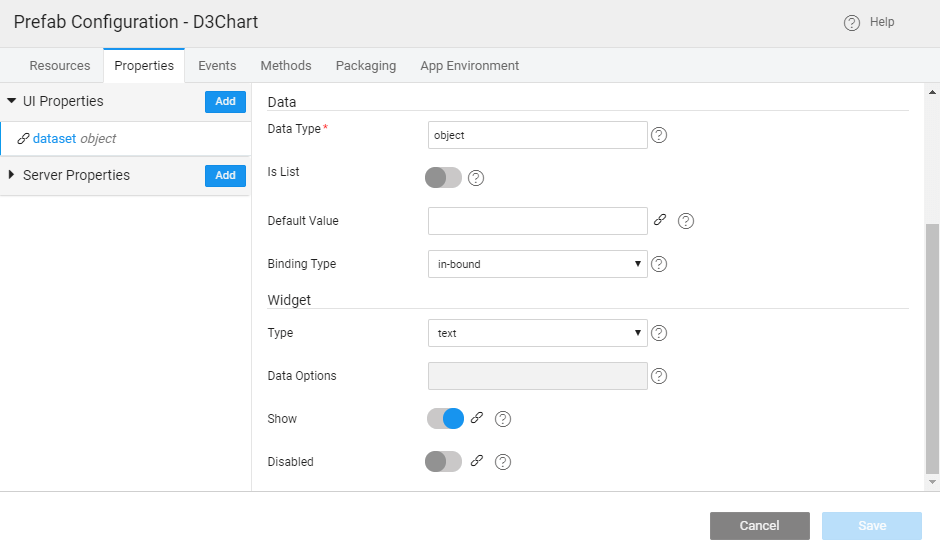
You can expose many properties and set the values as static or dynamic to be bound. For details of the properties that can be exposed refer to the D3 website.
- Add Property - dataset with attributes Widget set to text, Type set to object (type it, if not selectable) and Bindable set to in-bound

- You can set the display icon and mention the group for Prefab from the Packaging tab
- You can publish the Prefab to a project for testing or publish it to EDN for making it available across the enterprise.
- Save and Publish the Prefab. You can set the version for the Prefab and Publish it. Know more about publishing Prefabs from here.
- Once approved by the EDN Admin, the Prefab will be available for use across the Projects. You can see the entry in the Artifacts list from the Developer Utilities on the Project Workspace. Import it to see the same in the Widget Toolbox of any Project within your workspace.
Using D3 Charts Prefab
- Open the app, where you want to incorporate this Prefab.
- If you have published to the app, in the Prefab section of the toolbox on the left, you will see the newly imported Prefab.
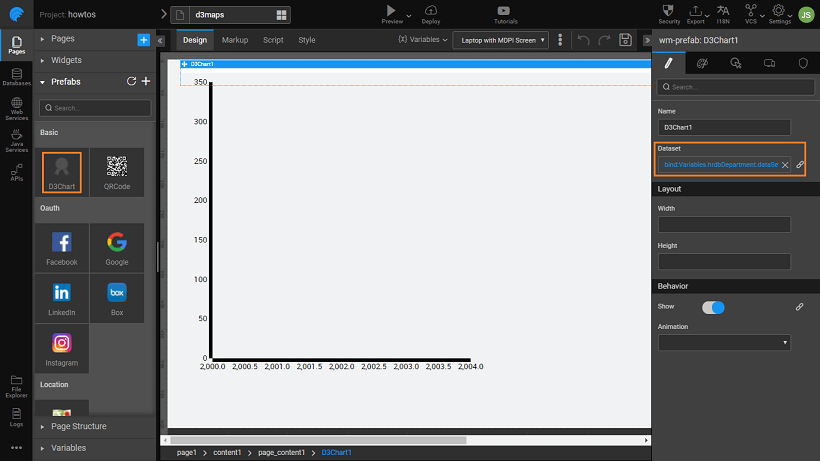
- Drag and drop the Prefab onto the canvas and Bind its dataset property. For this example, we have bound it to the HrdbDepartmentData dataset, which is available on the import of sample database
- Preview the app
Implementing NVD3 Charts
In the previous section, we have seen a simple implementation using D3 Chart. This section we will see the implementation of NVD3 charts. NVD3 is wrapper upon D3 which simplifies the implementation when compared to D3. These can also be incorporated easily into WaveMaker applications. In this section, we will see how to implement the Line Plus Bar Chart as seen here.
his implementation is for NVD3 version: 1.8.4 charts.
Click on Create from the Prefab tab of the Project Dashboard
Enter a name and description for the Prefab
SAVE the project setting without making any changes
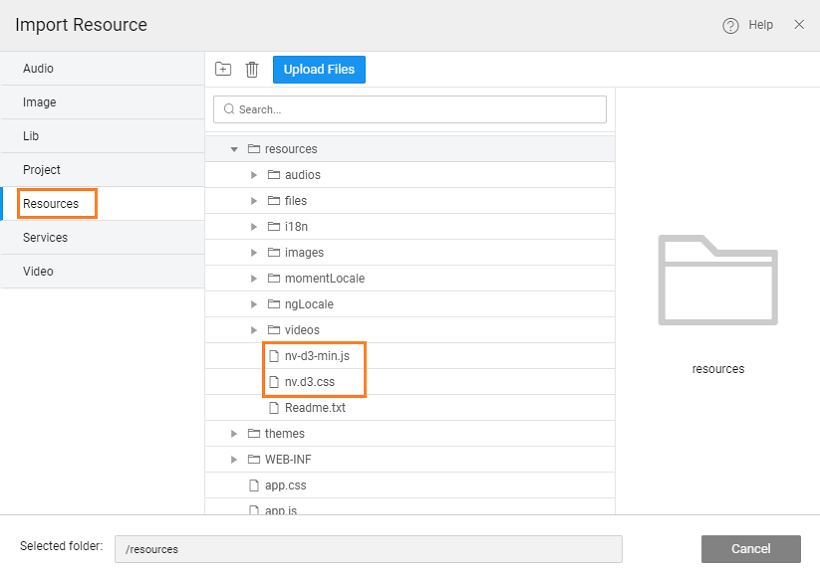
Import Resource to import the following resource files: nv-d3-min & nv-d3 file into the Resource folder of your Prefab (download and extract the files).

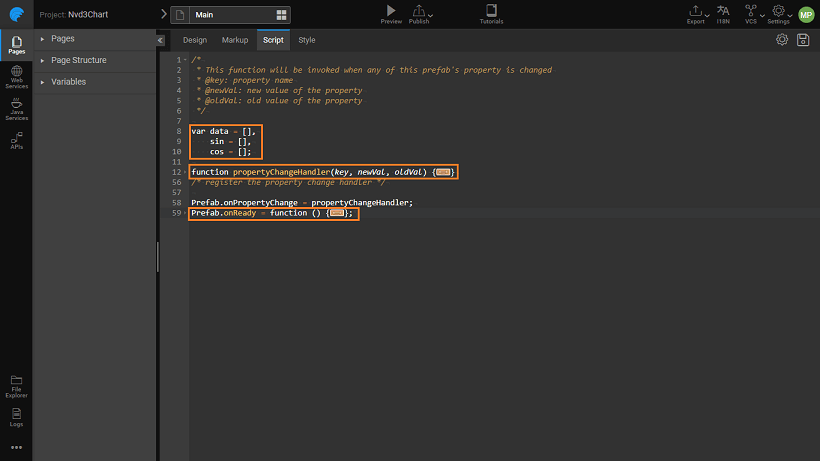
Open the SCRIPT tab of the Main page
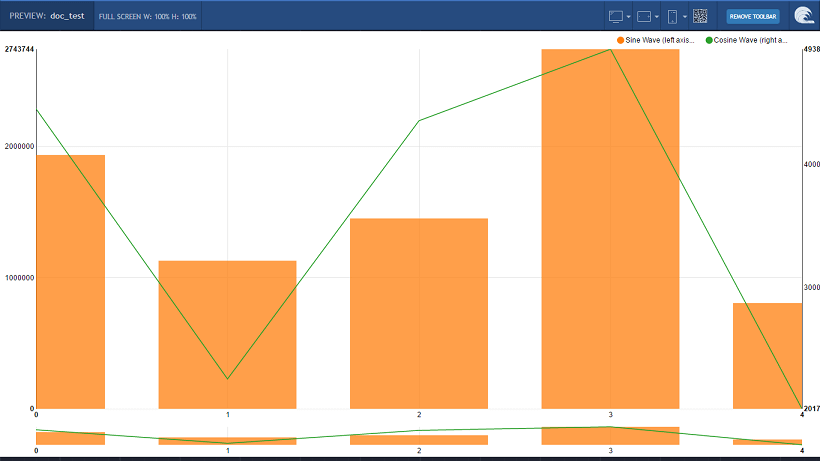
Enter the following code (you can copy and paste the same). This code generates the sin and cosine values that can be represented on the chart. Note that for the sin values, the bar attribute is set to true, thus the sine values are represented as bar chart while cosine values are represented as line graph. Click here for the code.
Enter the following function, too, within Prefab.onReady function after the above code. This code is to set up the visual rendering of NVD3 chart. Click here for the code

In the MARKUP tab add the following code within the wm-content tag:

Preview the app.
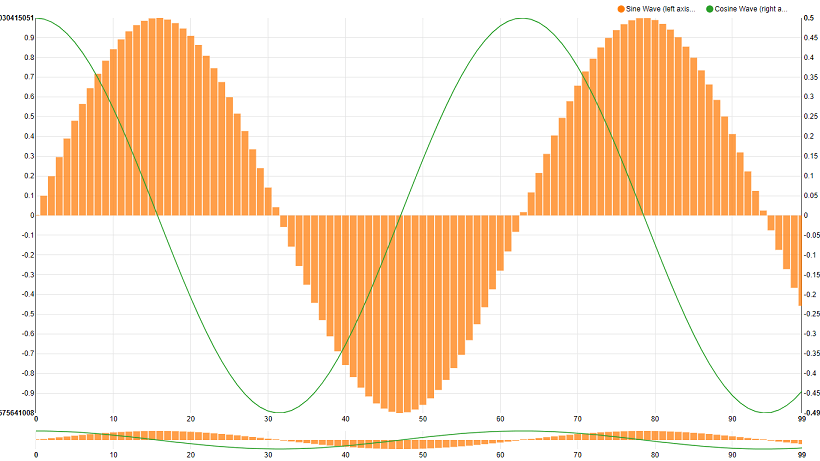
Try selecting a part of the graph from the bottom miniature graph and see the UI changes
To be used as the Prefab, it would be nice to bind the data to an object in the app using the Prefab instead of static graph display. Next couple of steps will help do the same.
From Project Configurations, choose Config Prefab under Settings:
- From Resources, include the script and css files imported earlier, you can pick from the drop down list
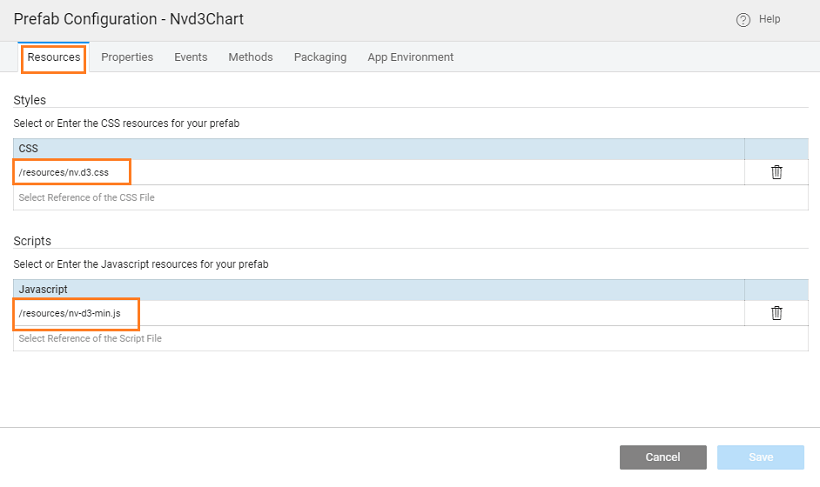
OR, You can instead include http url in place of script and style files: https://cdnjs.cloudflare.com/ajax/libs/nvd3/1.8.4/nv.d3.css https://cdnjs.cloudflare.com/ajax/libs/nvd3/1.8.4/nv.d3.min.js


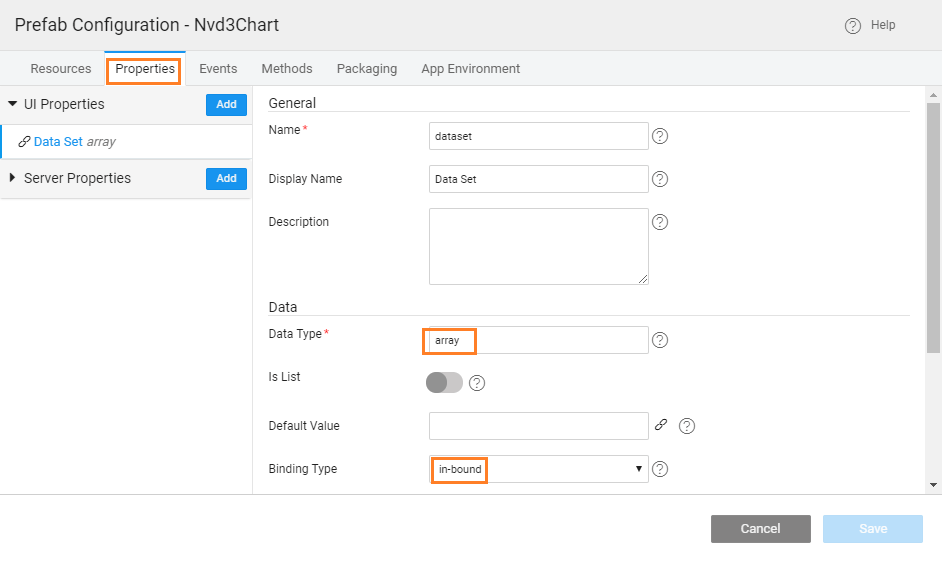
You can expose many properties and set the values as static or dynamic to be bound. For details of the properties that can be exposed refer to the NVD3 website.
Add property dataset, with text as widget, array (type if not selectable) as type and in-bound as the bindable attributes.
Add the following code to the propertyChangeHandler function. This function is triggered when the Prefab property changes in the incorporated app. This replaces the data built in the onInitPrefab function. Here, instead of taking static data, we are using the object passed to the Prefab to calculate the values to be represented on the x- and y-axis. The input object, according to the below code snippet, is expected to have two fields budget and q1. We are using this since in the app incorporating this Prefab we will see the binding with Department database. Add the following variable declaration:
You can publish the Prefab to a project for testing or publish it to EDN for making it available across the enterprise.
Save and Publish the Prefab. You can set the version for the Prefab and Publish it. Know more about publishing Prefabs from here.
Once approved by the EDN Admin, the Prefab will be available for use across the Projects. You can see the entry in the Artifacts list from the Developer Utilities on the Project Workspace. Import it to see the same in the Widget Toolbox of any Project within your workspace.

Using NVD3 Charts Prefab
- Open the app, where you want to incorporate this Prefab
- Since we published the Prefab, in the Prefab section of the toolbox on the left, you will see the newly imported Prefab
- Drag and drop the Prefab onto the canvas and bind its dataset property. For this example, we have bound it to the HrdbDepartmentData dataset, created from the Database CRUD APIs available on the import of sample database
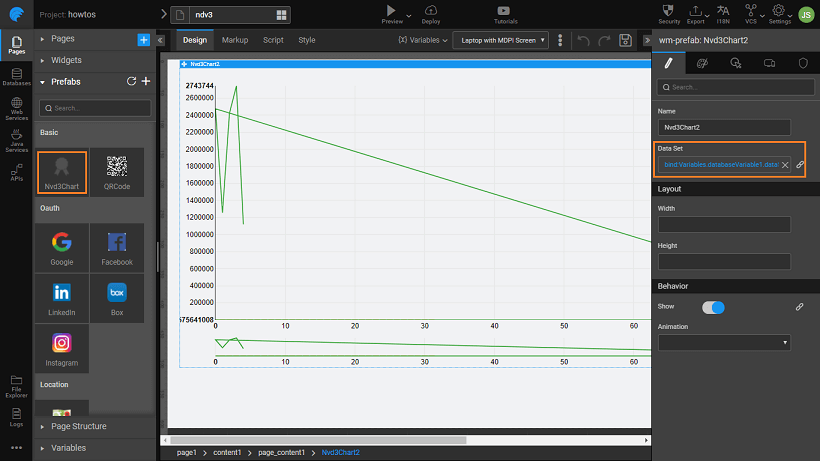
Preview the app.

See Also
Prefab to compare two strings
Prefab using 3rd Party UI Widgets
Prefab Using D3 Library (DataMaps)
Prefab Using JQuery Plugin - showcases using Events and Methods