Debug React Native Web Preview
Prerequisites
- Install React Developer tools from the Google Chrome web store.
Debugging Procedure
- Open the app preview URL in Google Chrome.
- You can view and debug page scripts easily. For this, press Ctrl+P or Cmd+P and enter the page name.
- Components tab of the React developer tools appear in Google Chrome debug tools. In this tab, one can see the React Component tree.
note
Avoid using the elements tree in the Google chrome debug tools.
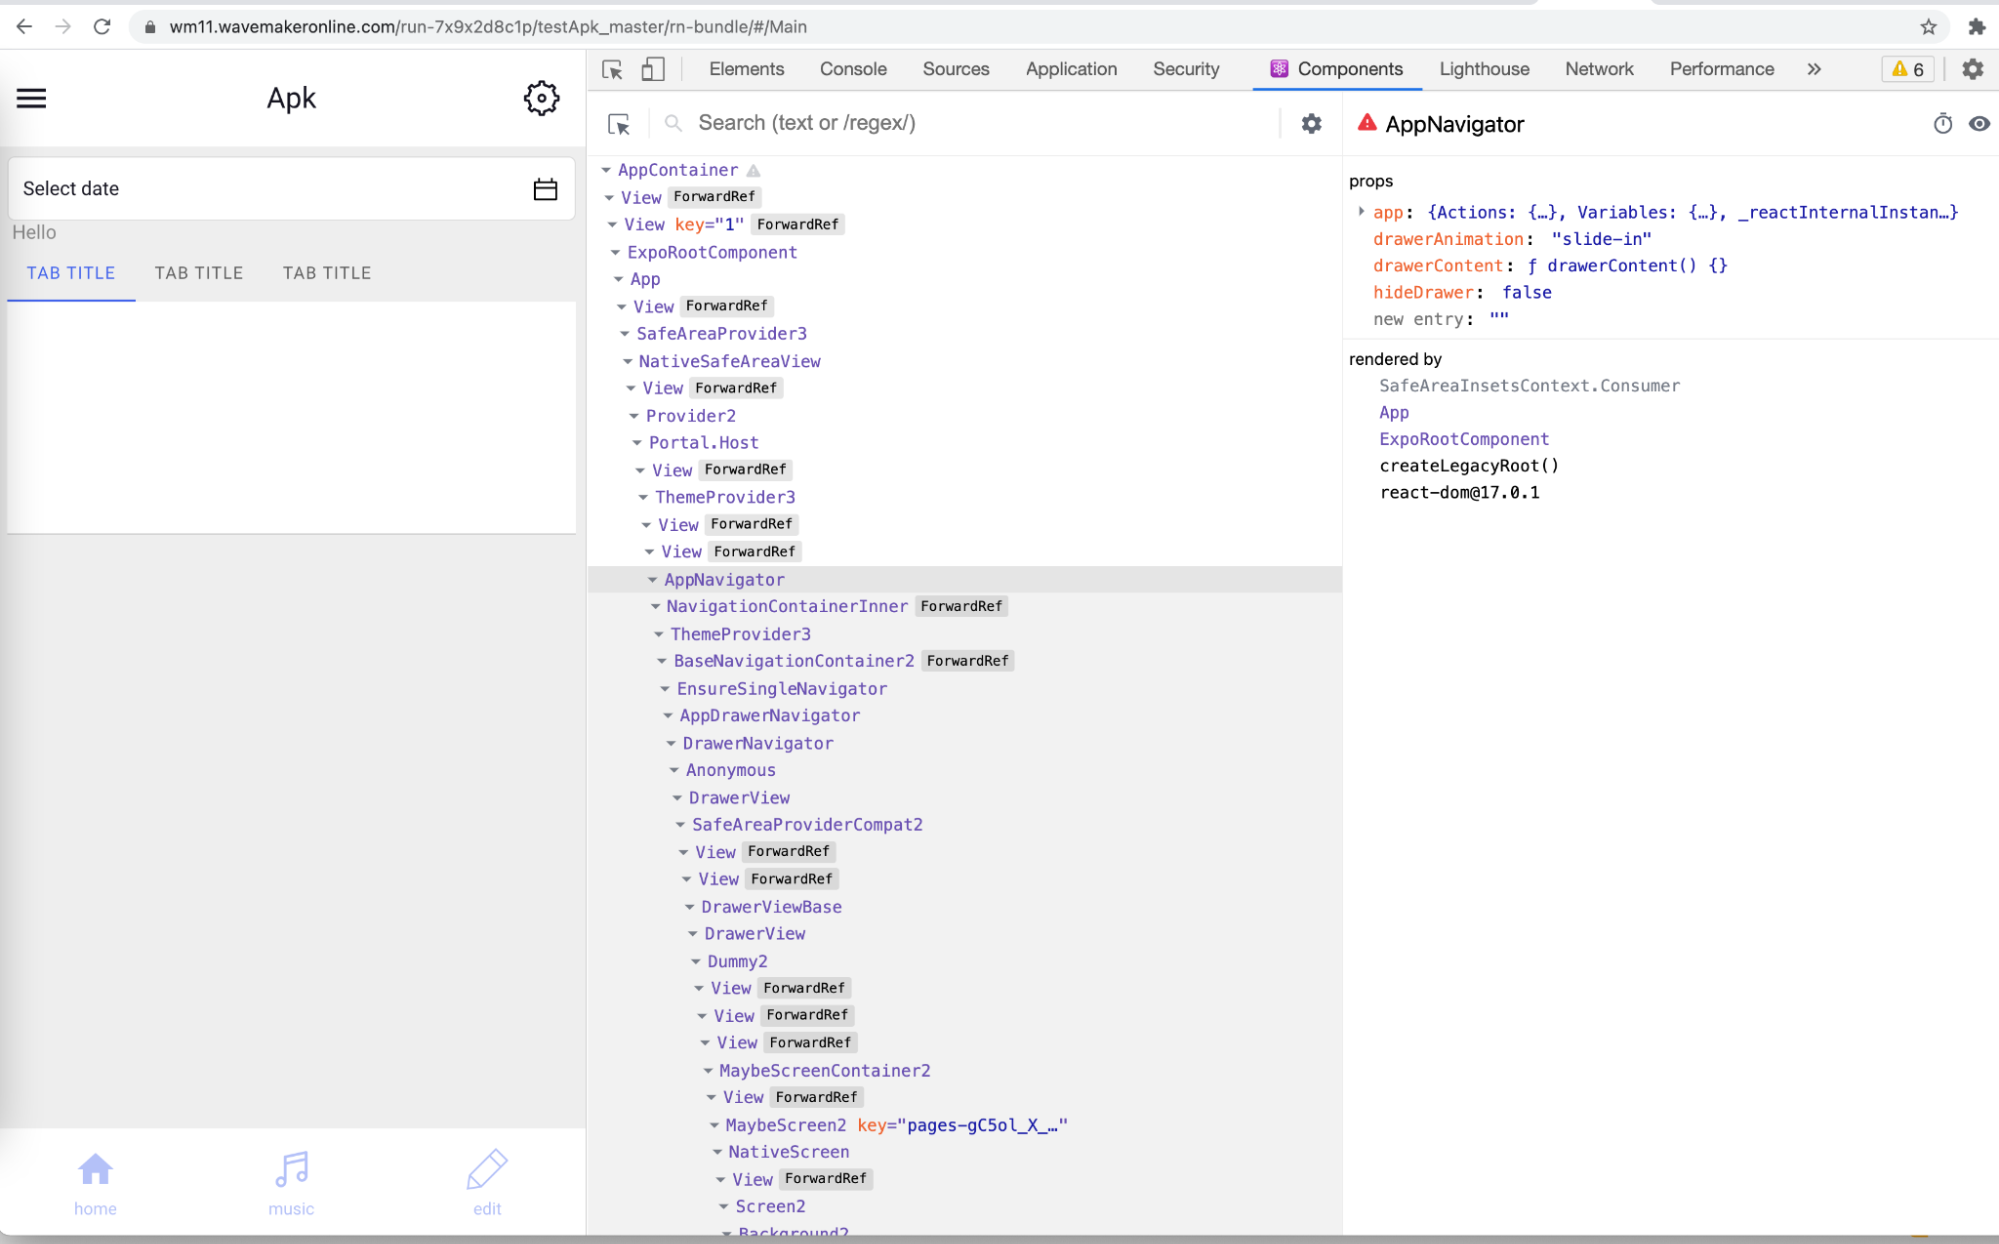
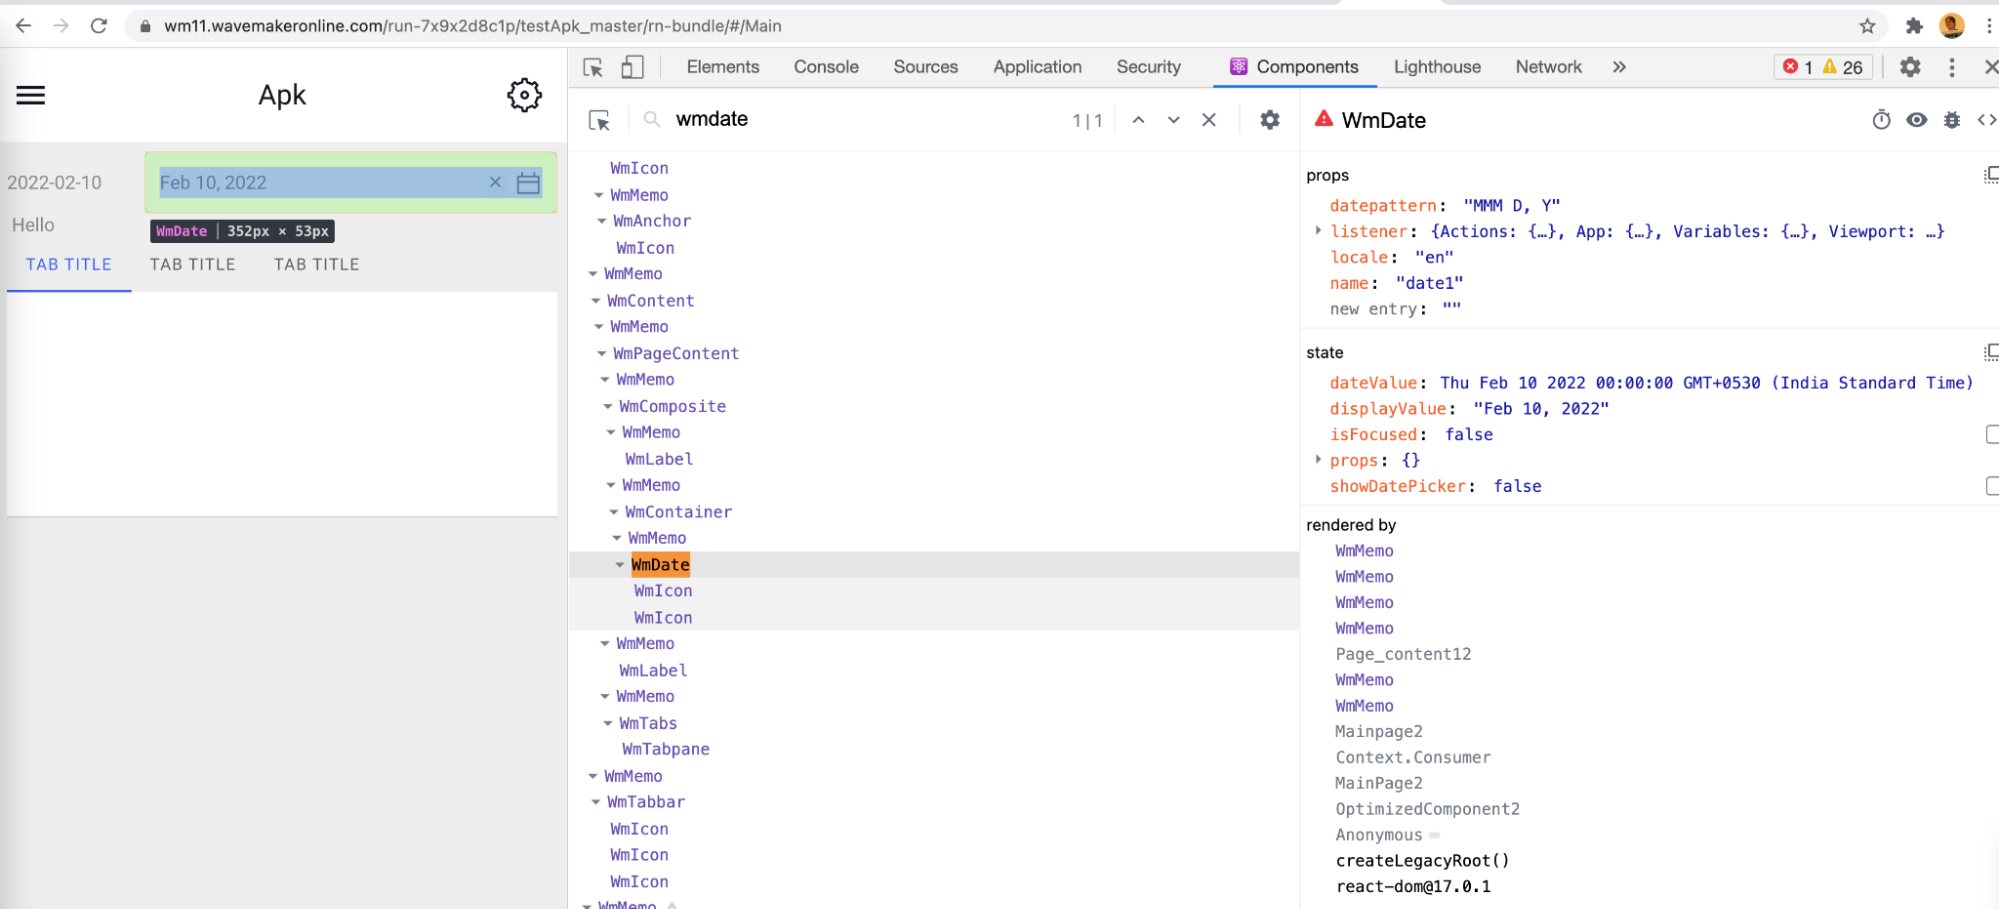
- Select the component to see its props, state, and style details.
- Using regular expressions, components in the tree can be hidden or shown.
- Click on the setting icon next to the search bar.
- Select the Components tab from the popup.
- Click on the add filter button.
- Mention the regular expression. ^(?!Wm) can be used to view only WaveMaker components.
- In style details, there is a trace object. Trace object contains sources that participated in the preparation of the final style. In the trace object, styles of later sources are overridden by the former sources.