In this blog we talk about how to make any WaveMaker application Observable by applying OpenTelemetry, Zipkin. While accelerating application development, WaveMaker's generated code allows easy integration with best of the breed tools and applying devops best practices while operating the app in production a cinch.
About Open Telemetry
Open telemetry is an opensource tool enabling Observability. Observability lets a developer understand an application from the outside without knowing its inner workings and helps in troubleshooting degradations in service quality. To achieve this, a developer should instrument the application. By instrumenting code to emit traces and metrics, and collecting such data developers make the application observable.
Once instrumented, the end user flows become traceable across different microservices. This data can be sent to Zipkin - a popular open source tool.
Benefits of implementing observability
Metrics, Logs and Traces make up the golden triangle of Observability of any application. WaveMaker built applications can also easily be set up for tracing.
- Understand why the applications has slowed down.
- Trace 500 error codes to figure out what went wrong among the microservices.
- What if one of the application calls is taking too long than expected.
OpenTelemetry tool integration with an application can help have detailed visibility of tracing an application to easily spot almost any issue or have an idea of where the problem could be. Instrumenting WaveMaker applications code lets you get traces for each request, along with their time slices captured in detail.
Four simple integration steps for Opentelemety
- Install and Setup tools
- Instrument application code
- Build and Deploy application
- Accessing request traces
1. Install and Setup tools
How to use OpenTelemetry integration to have complete visibility of the application, Here in this first step explains details to Install and Setup tools and integrate OpenTelemetry and Zipkin with the application deployed at Apache Tomcat.
Install Zipkin as default data collector and tracing dashboard. Once the following docker command is run, browse to http://your_host:9411 to find traces. Dashbord will be empty initially.
docker run -d -p 9411:9411 openzipkin/zipkinWaveMaker application can be deployed on specific versions of Apache Tomcat. Install Tomcat by following installation instructions and then copy step 1 downloaded opentelemetry-javaagent.jar to tomcat lib directory($TOMCAT_HOME/lib/)
2. Instrument application code
OpenTelemetry code instrumentation is supported for Java based applications, here are the steps to Instrument application code.
- Download latest open telemetry opentelemetry-javaagent.jar from the Open Telemetry repo and place the JAR at preferred directory and launch it with tomcat.
- Set environment variables by adding the
setenv.shfile above the installed tomcat bin directory.
$TOMCAT_HOME/bin/setenv.sh
    export CATALINA_OPTS="$CATALINA_OPTS -javaagent:/usr/local/tomcat/lib/opentelemetry-javaagent.jar”
    export OTEL_TRACES_EXPORTER=“-Dotel.traces.exporter=zipkin”
    export  OTEL_EXPORTER_ZIPKIN_ENDPOINT=“-Dotel.exporter.zipkin.endpoint=http://<zipkin-host-ip>:<zipkin-port>/api/v2/spans”
    export OTEL_SERVICE_NAME=”-Dotel.service.name=<App/service name>”
    export JAVA_OPTS=”$JAVA_OPTS $CATALINA_OPTS $OTEL_TRACES_EXPORTER $OTEL_EXPORTER_ZIPKIN_ENDPOINT $OTEL_SERVICE_NAME”
Here Zipkin server should be accessible to the tomcat server.
- Introduce tracing code:
To introduce tracing and create correlations Spring AOP(Aspect Oriented Programming) code changes needed, this code can also be introduced by using the IDE at WaveMaker application.
Download WaveMaker Application Zip from Studio, extract the downloaded zip file to a directory and call it as$WMAPP_HOMENavigate to the mavenpom.xmlfile to add following dependencies code snippet
$WMAPP_HOME---->pom.xml
      <dependencies>
        <dependency>
              <groupId>io.opentelemetry</groupId>
              <artifactId>opentelemetry-sdk</artifactId>
              <version>1.11.0</version>
        </dependency>
       <dependencies>
Navigate to the project-user-spring.xml in the below path and add the given snippet
$WMAPP_HOME -----> src/main/webapp/WEB-INF/project-user-spring.xml
          <beans xmlns="http://www.springframework.org/schema/beans"
              xmlns:xsi="http://www.w3.org/2001/XMLSchema-instance"
                  xmlns:aop="http://www.springframework.org/schema/aop"
              xsi:schemaLocation="http://www.springframework.org/schema/beans http://www.springframework.org/schema/beans/spring-beans.xsd
              http://www.springframework.org/schema/aop
                  http://www.springframework.org/schema/aop/spring-aop-3.0.xsd ">
                  <!--<context:component-scan base-package="com.aop.aspect"/>-->
                  <bean id="LogAspect" class="com.aop.aspect.LogAspect"/>

              <aop:config>
                <aop:aspect id="myaspect" ref="LogAspect" >
                   <!-- @Before -->
                   <aop:pointcut id="pointCutBefore" expression="within (com.wavemaker.*.*.controller..*) || within (com.wavemaker.runtime.rest.controller..*)|| within (com.*.*.controller..*)"/>
                   <aop:before method="before" pointcut-ref="pointCutBefore" />
                </aop:aspect>
              </aop:config>
          </beans>
Create a new java file with given package structure and copy code to the created Java source file
$WMAPP_HOME ----->src/main/java/com/aop/aspect/LogAspect.java
          package com.aop.aspect;

          import org.aspectj.lang.JoinPoint;
          import org.slf4j.Logger;
          import org.slf4j.LoggerFactory;
          import io.opentelemetry.api.trace.Span;
          import jakarta.servlet.http.HttpServletResponse;
          import org.springframework.beans.factory.annotation.Autowired;
          public class LogAspect {

              private static final Logger logger = LoggerFactory.getLogger(LogAspect.class);

              @Autowired
              private HttpServletResponse response;

             public void before(JoinPoint jp) {
                  Span currentSpan = Span.current();
                  currentSpan.setAttribute("x-wm-request-track-id", response.getHeader("x-wm-request-track-id"));
              }
          }
3. Build and Deploy application
Build and Deploy application to reflect above instrumentation code change
- With above changes build WaveMaker app for WAR and copy built war to tomcat setup at webapps folder
($TOMCAT_HOME/webapps) - Restart the tomcat server to reflect above changes at
setenv.shalong with the WaeMaker application.
4. Accessing request traces
Accessing request traces with Use Cases Here is the introduced sample use case at WaveMaker application to imitate calls to other external services, or another microservice and a call to database engine into the application. Following are the Zipkin screenshots where time taken by application request is spent in each function, to pin where the problem is with the call to the microservice and focus on reducing the latency in a service considering the time details exposed. Or, These traces can be used to understand what the workflow of a request is. Another advantage that works is by introducing trace ID in the response payload of the WaveMaker application and using that ID to correlate with other dependency calls.
Every time when a hit to service endpoint of an application is made a trace is captured at Zipkin, to see something like this at Zipkin dashboard by accessing url http://your_host:9411, here are few WaveMaker application request traces.
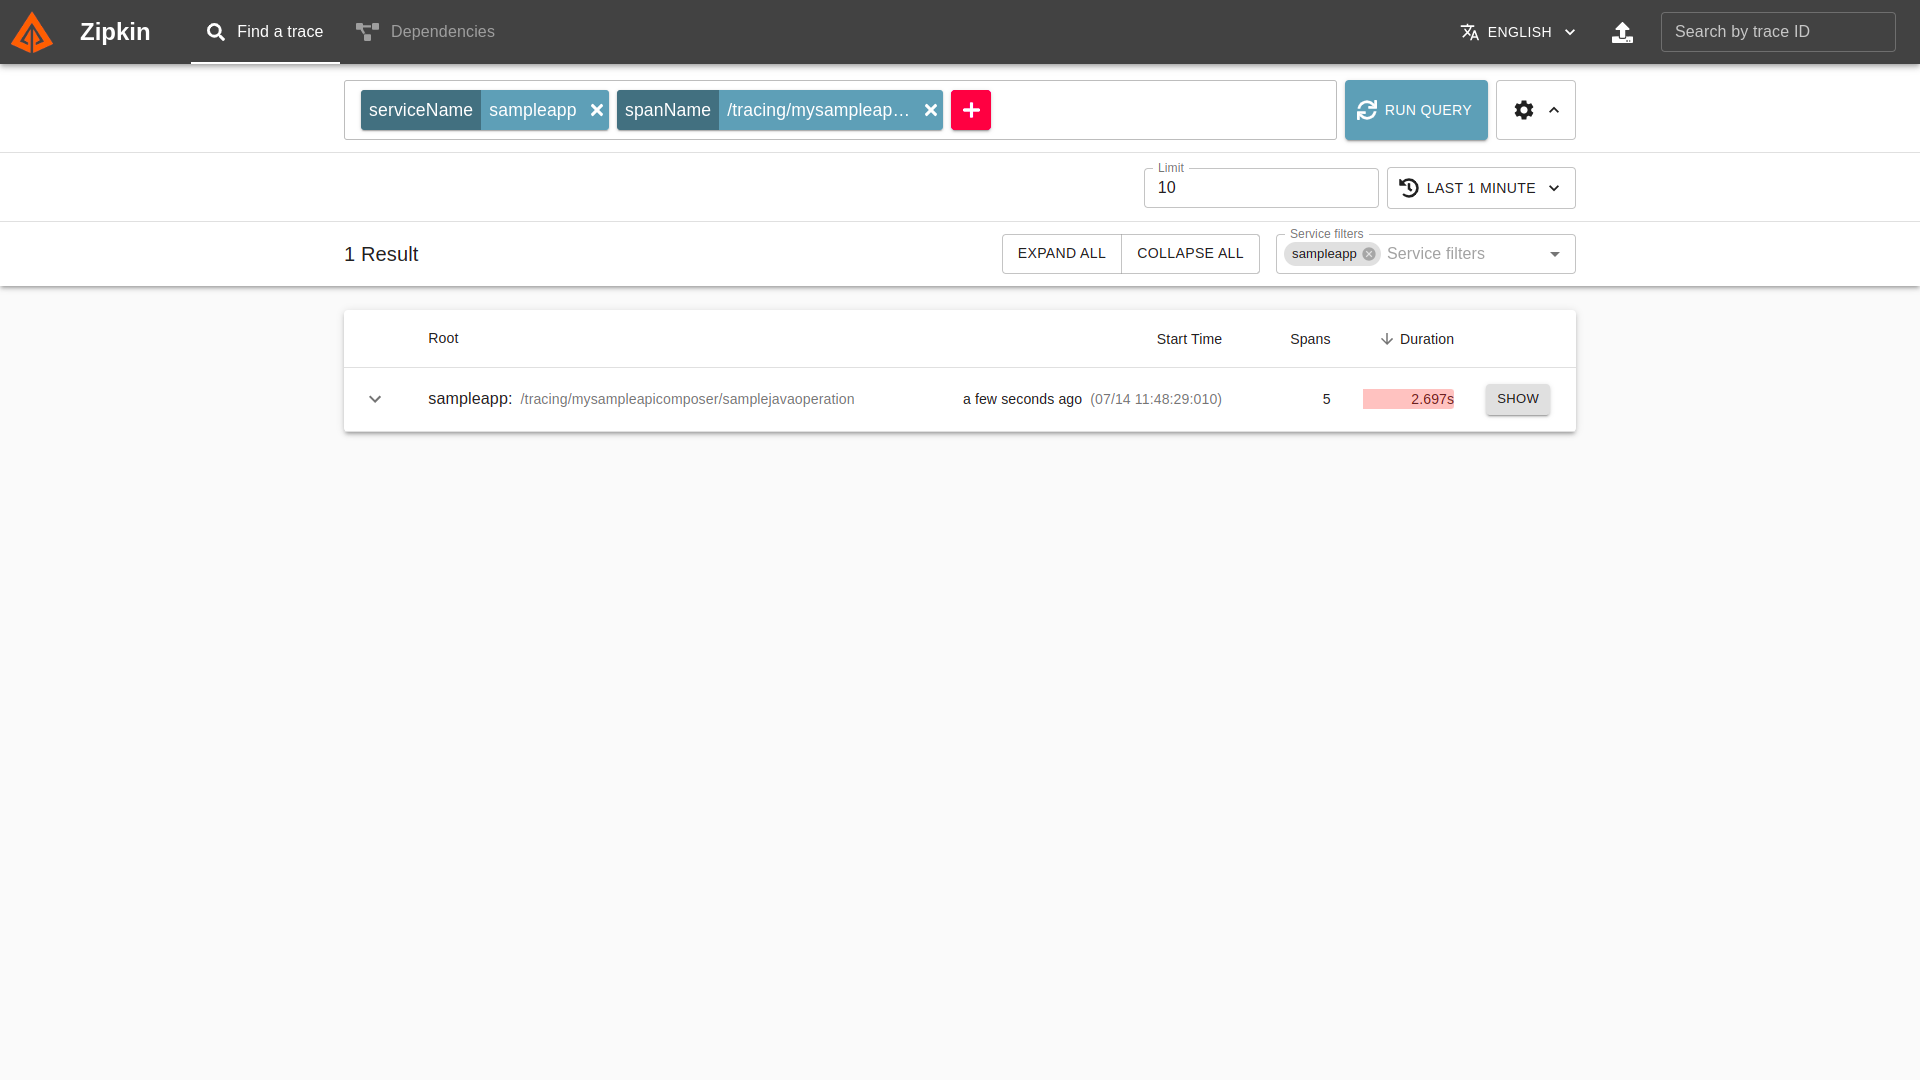 Click on the show button to see WaveMaker API Composer call details
 WaveMaker API Composer call trace info with its status code(500) and Server response time details.
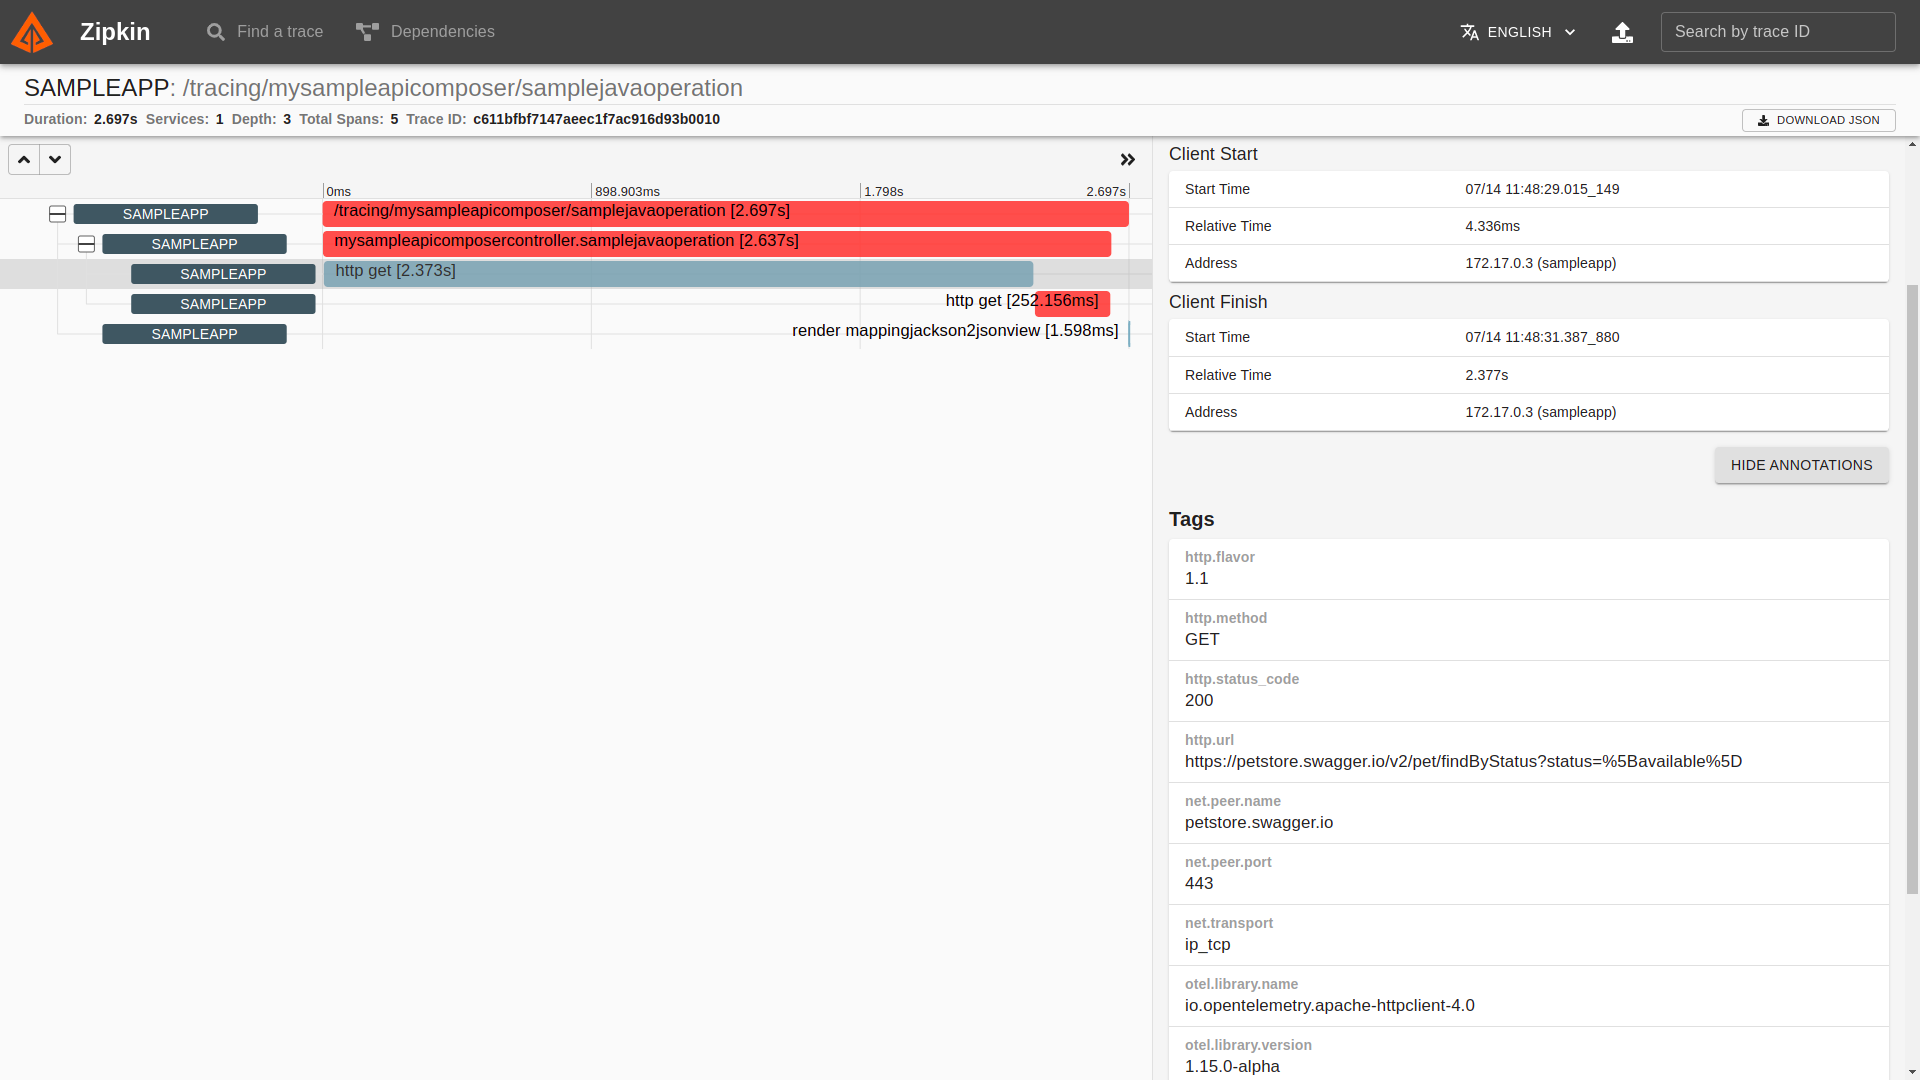 WaveMaker API Composer first GET call with its status code(200) and response time details.
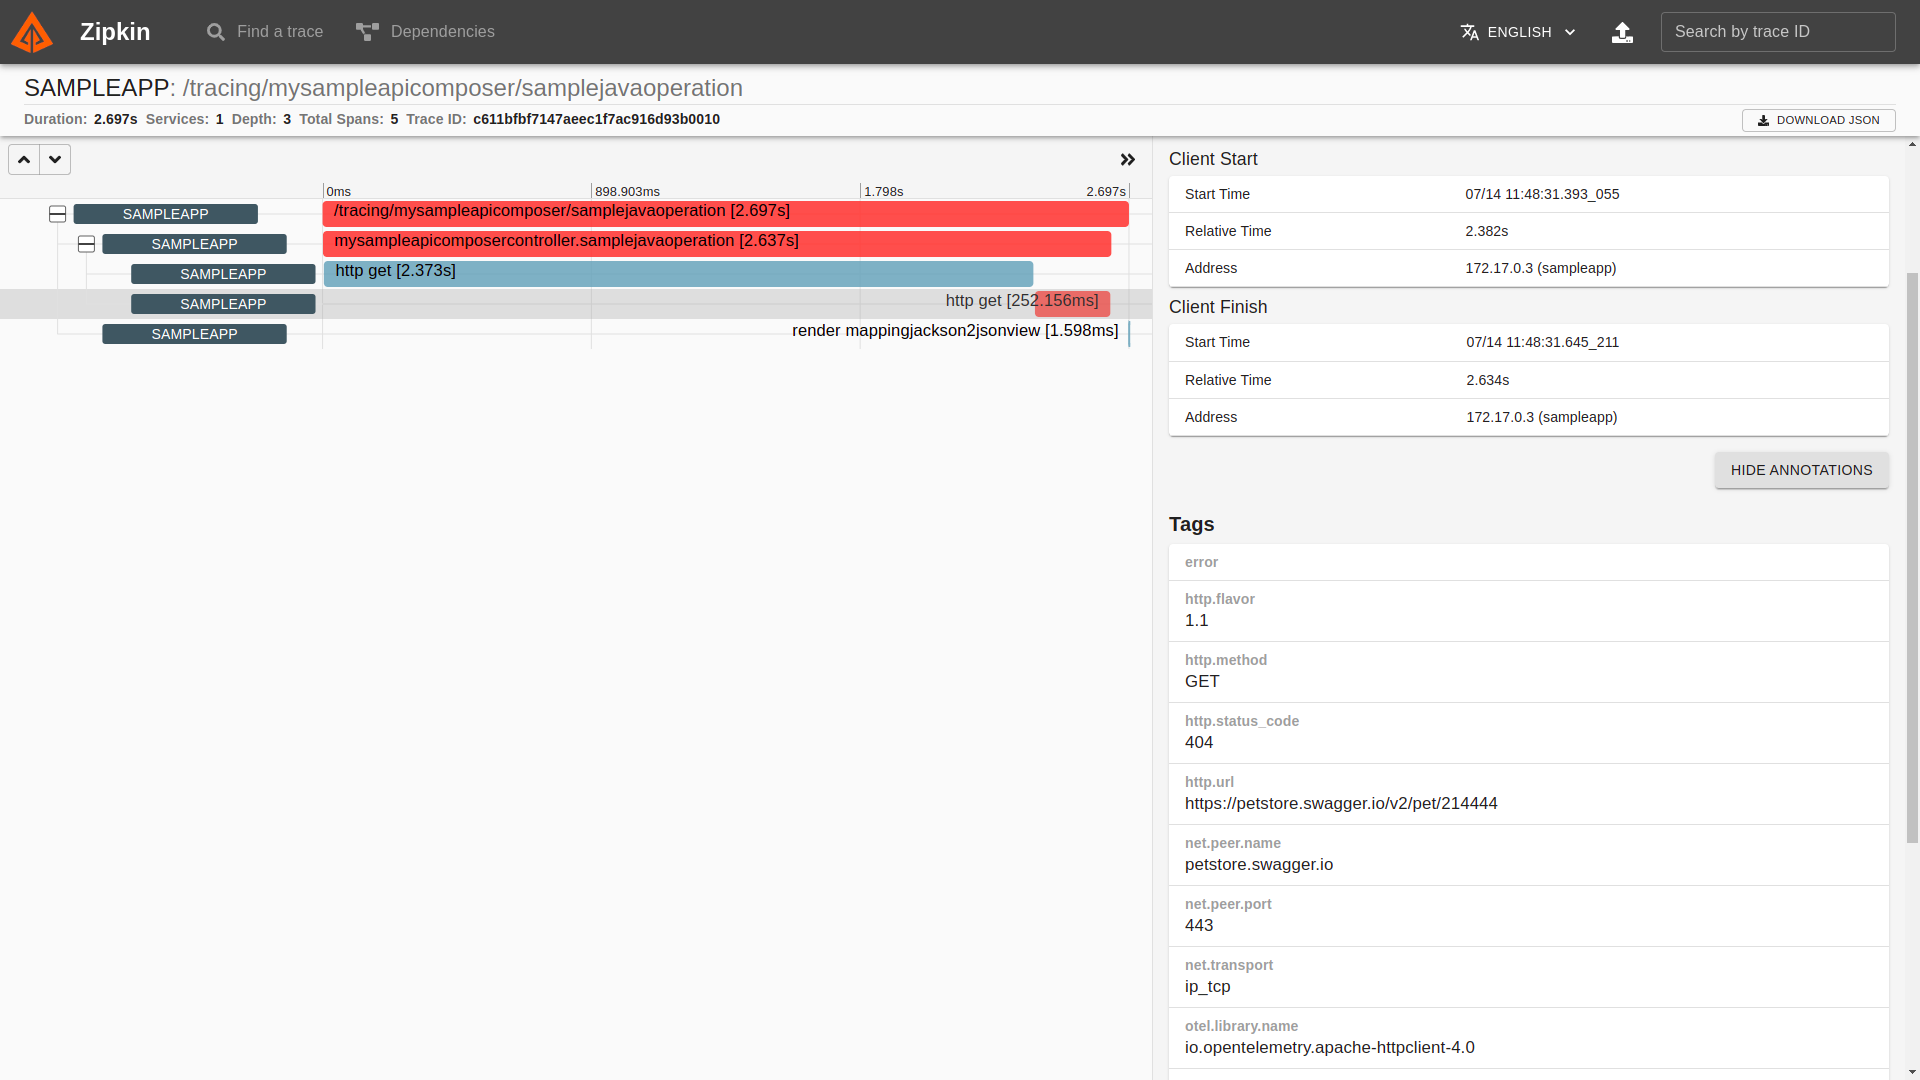 WaveMaker API Composer second GET call with its status code(404) and response time details.
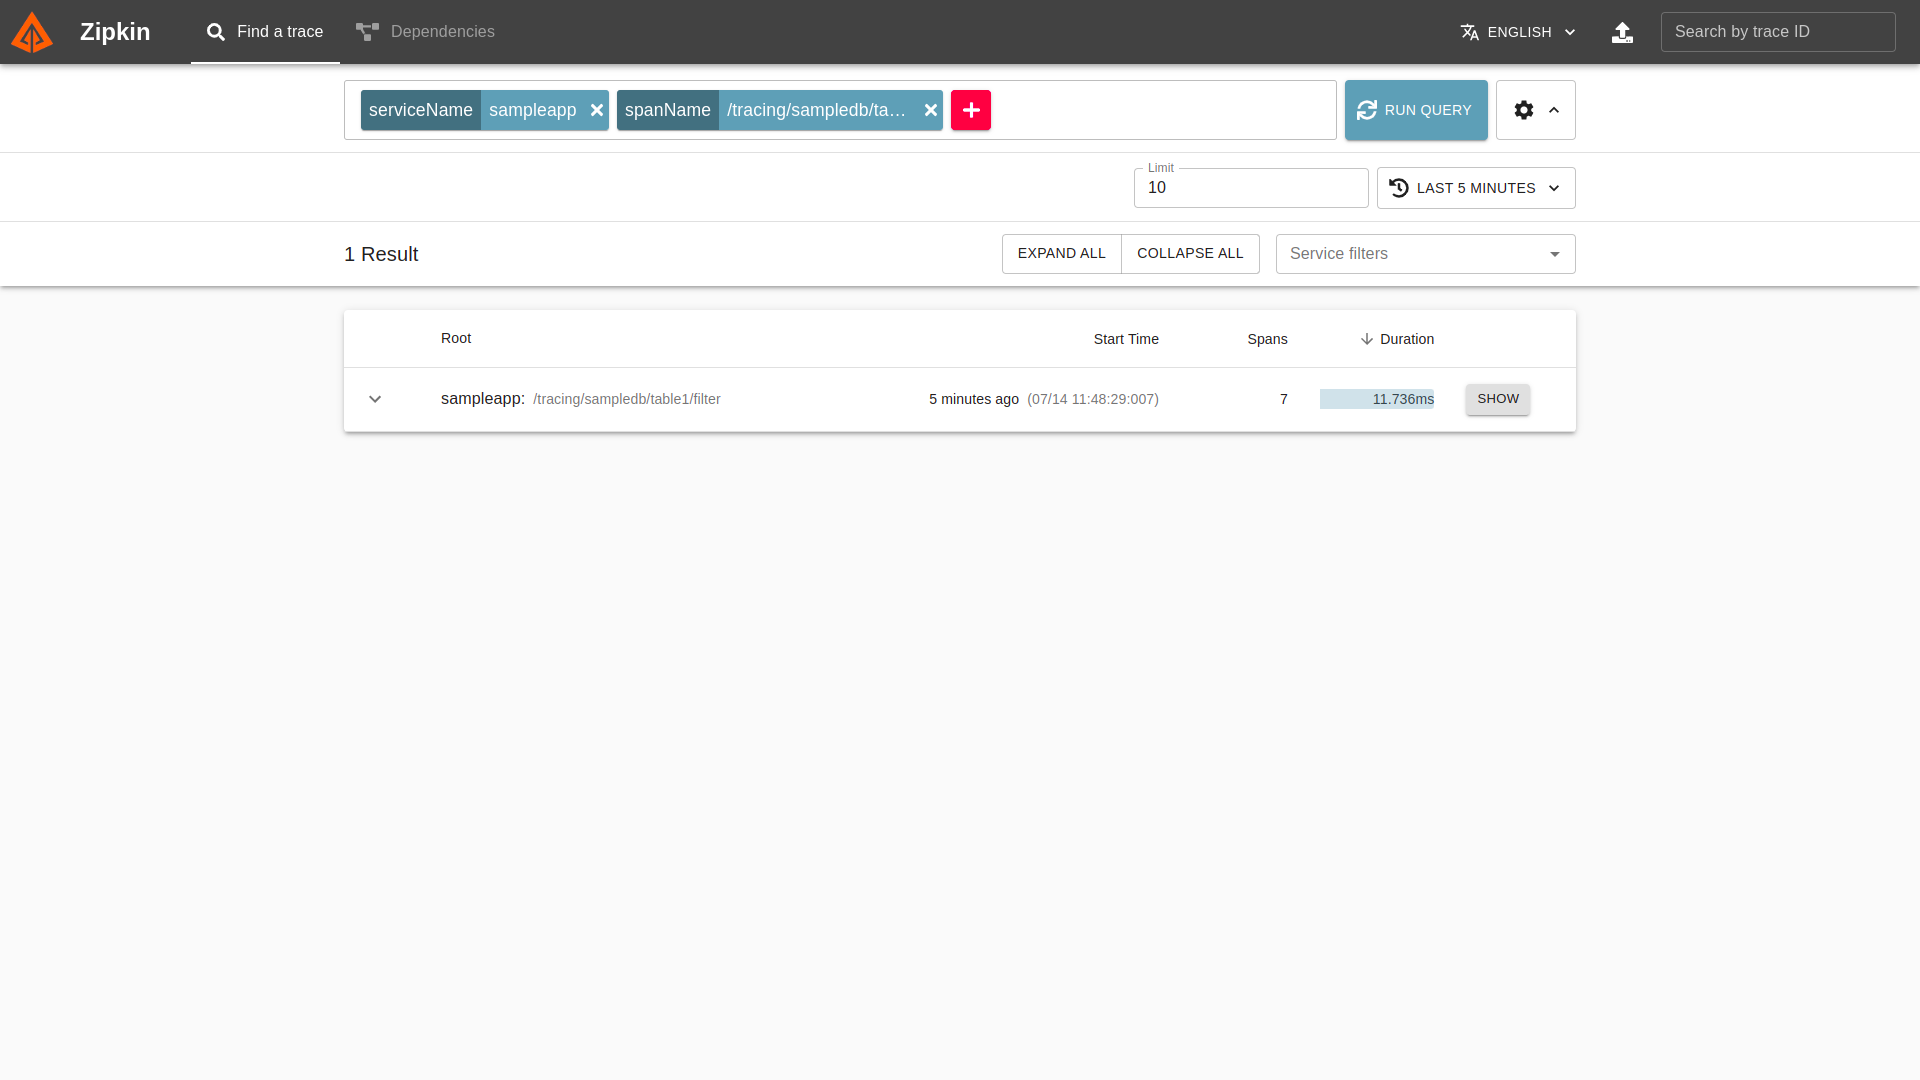 Click on show button for WaveMaker API call details
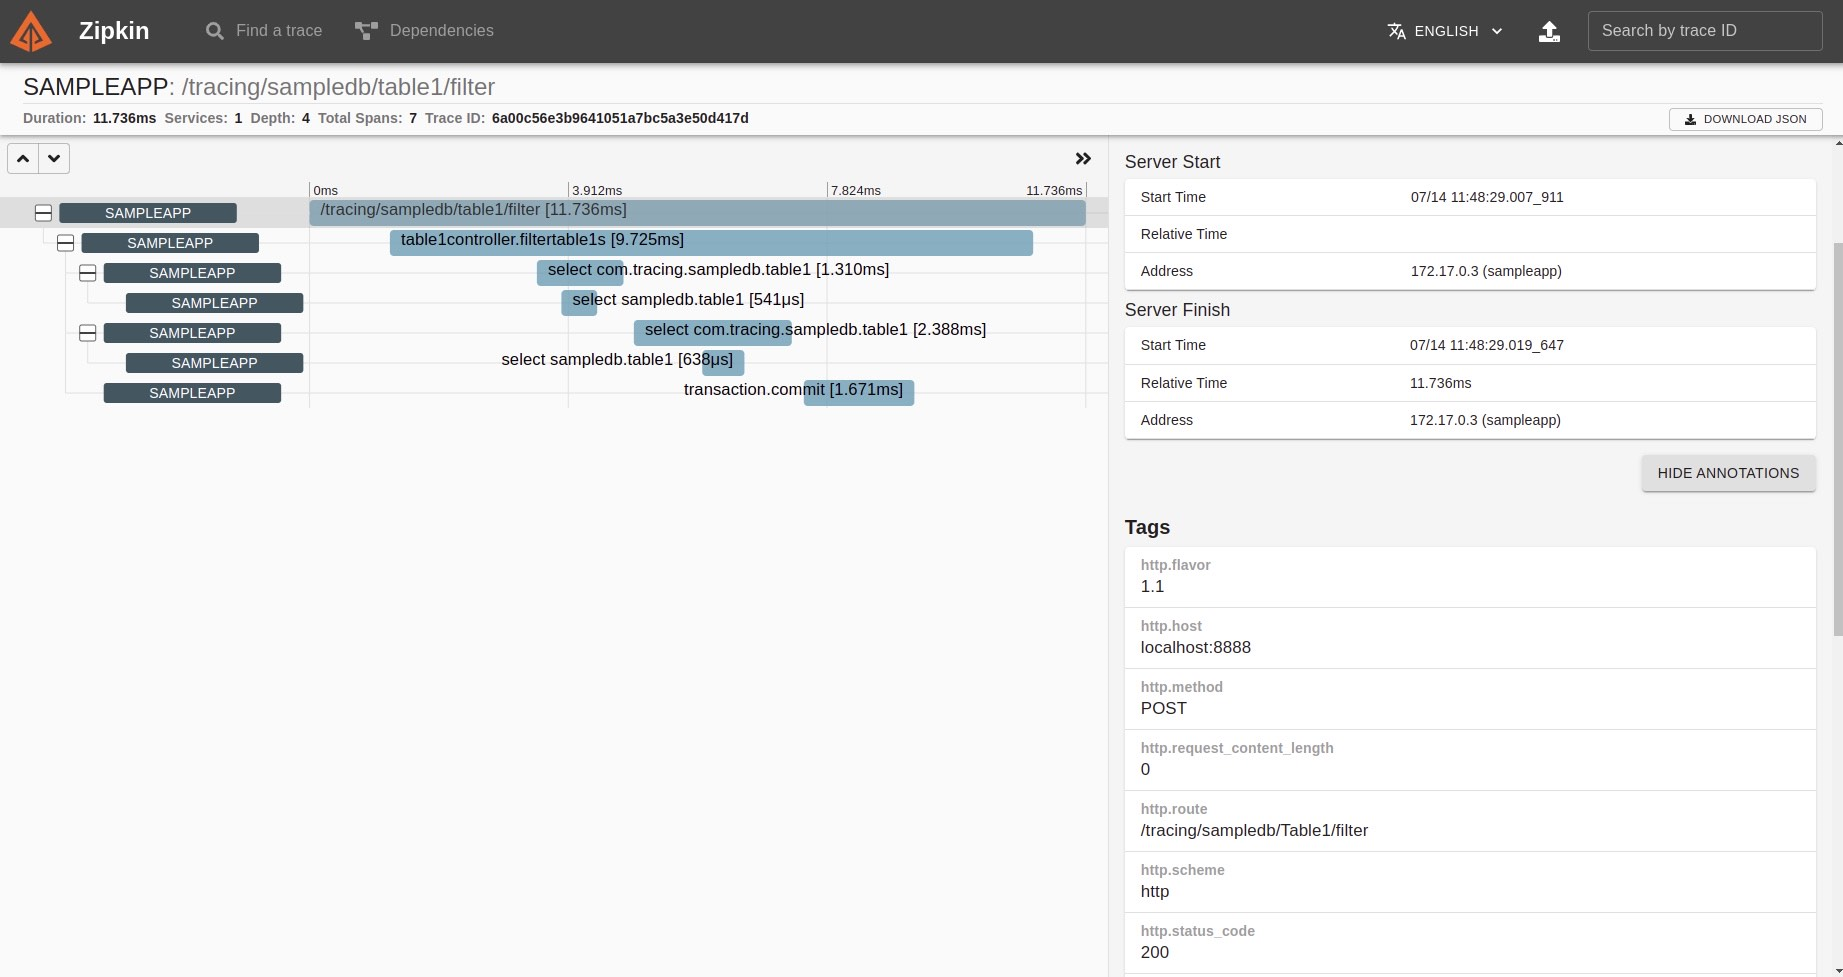 WaveMaker API generated to access DB trace info along with its status code(200) and response time details.
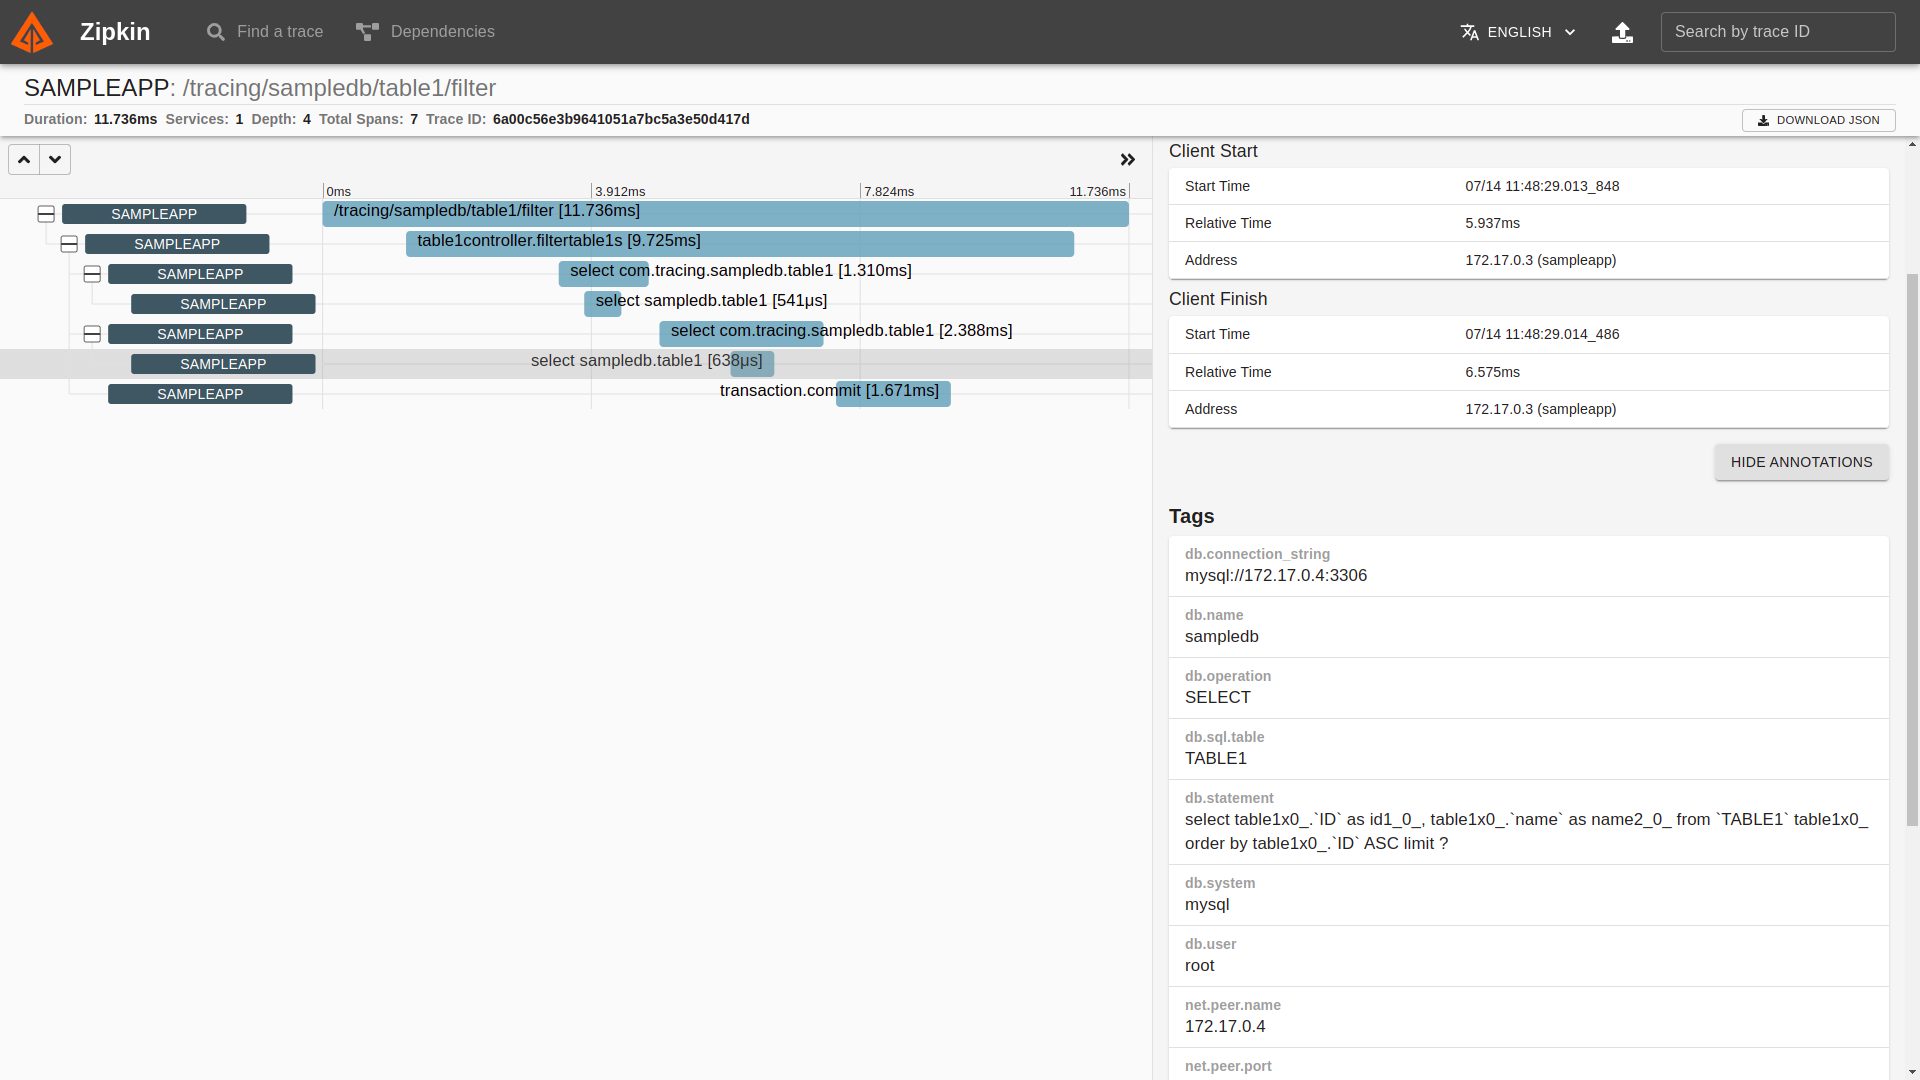 WaveMaker API generated to access DB query and its response time details.