Alongside the crisis that COVID-19 had brought to the world, there has never been so much prominence for the numbers. Almost every household, governments, businesses, media etc. are contemplating these numbers, creating models for prediction, taking measures to flatten these curves. That’s when we immediately jumped on to create an application using our own low-code platform.
Using WaveMaker, you can almost instantly create a chart or plot for visualization from any datasource. There are several API sources for COVID-19 data and with no code, using out-of-the-box widgets and charts the application has been built in just a few days.
In this series of blog post, we discuss how to build a dashboard, and in the next post, we will see how to build visualization for charts and maps. But before, let's do a little walkthrough of the app.
Corona Tracker App
Link to the app: http://apps.wavemakeronline.com/CoronaTracker/
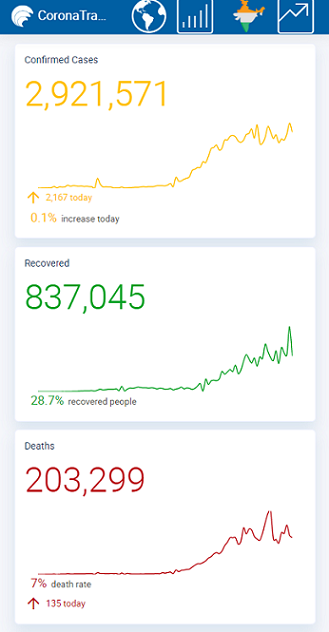
Not only can you quickly build the dashboard, it is responsive automatically and one can access it on a mobile device as well as on a large screen.
Quick walkthrough of the app
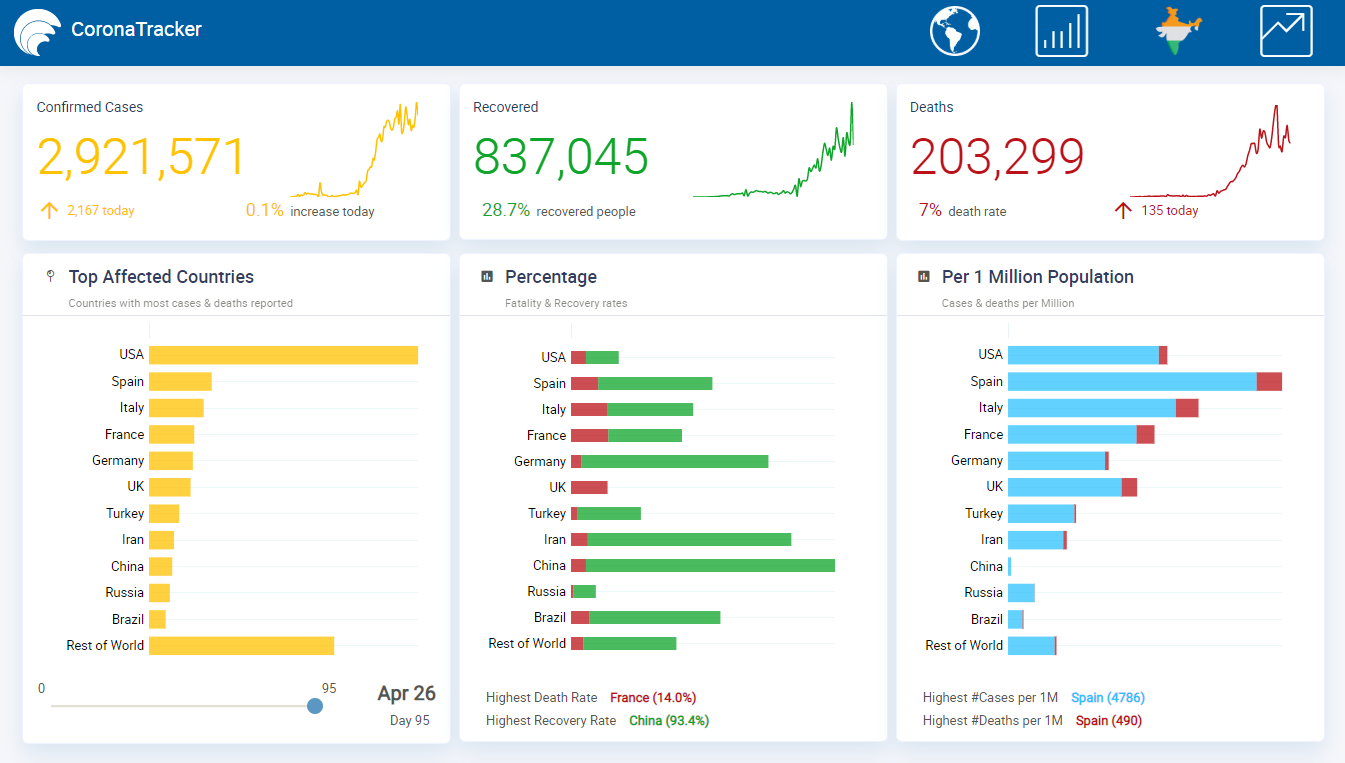
The Corona Tracker application has an extensive dashboard with key metrics globally, i.e. Confirmed cases across several countries, recovered, deaths reported etc. The dashboard provides visualization for top 10 affected countries, plotting their death rates against recovery percentages, number of affected people in 1 million population etc.
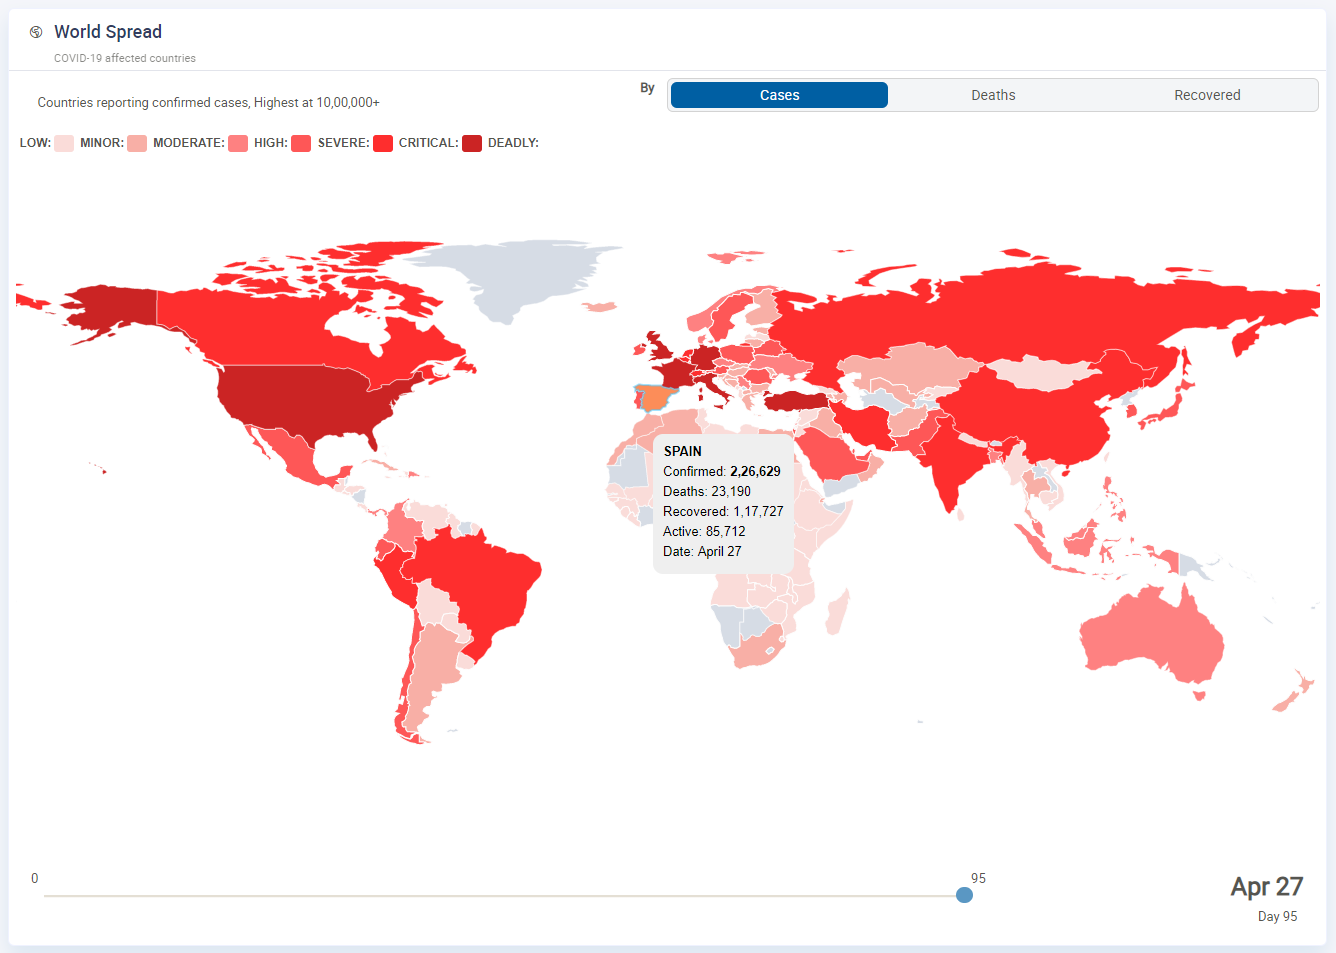
This app also features datamaps with data set published by John Hopkins University, to visualize the spread of COVID-19 across the globe over a timeline.
How to build the dashboard
Using WaveMaker, the elements of the dashboard can be built in just 4 steps without writing code.
- Import datasource, REST API in this case
- Create variable to access the REST API
- Visually drag-n-drop widgets onto the canvas or editor
- Bind the widgets to Variable
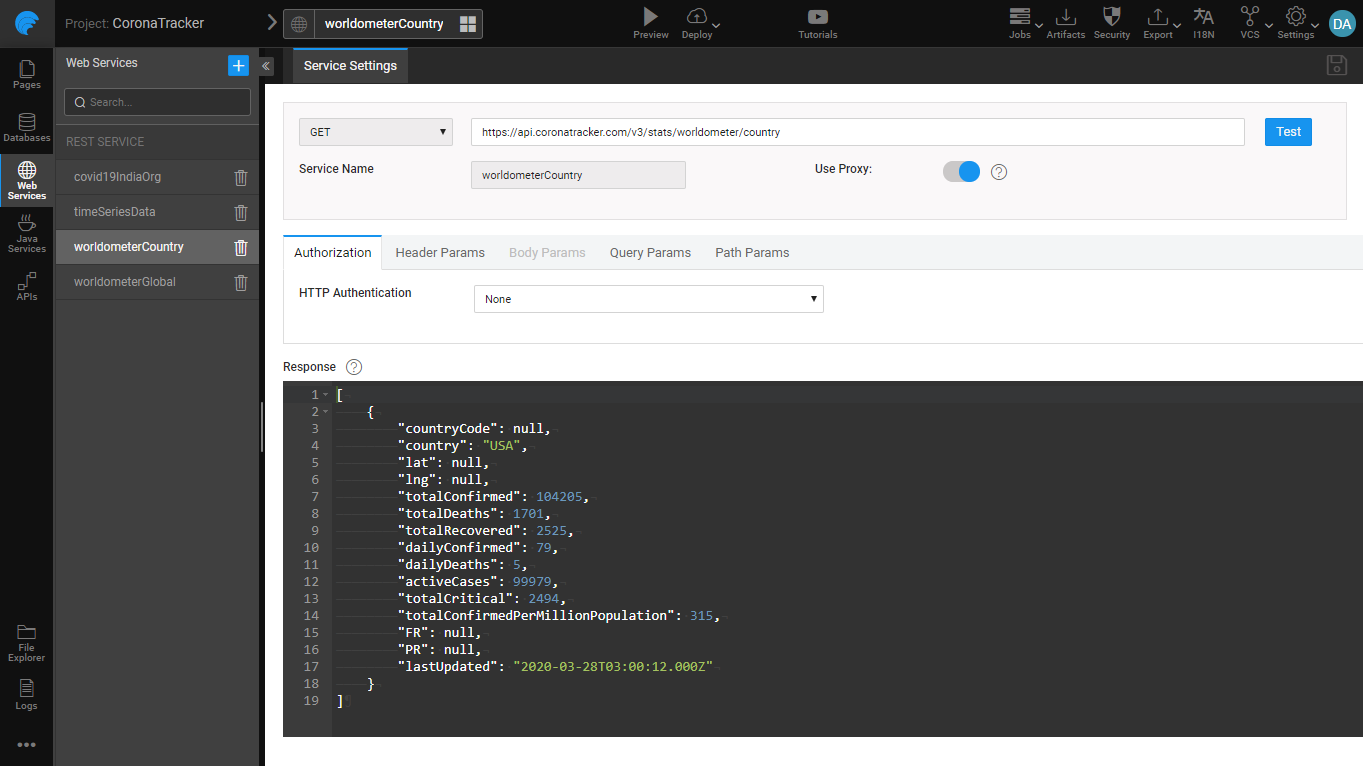
Step 1: Import datasource, REST API in this case
The primary source of data for the dashboard are the following 2 REST APIs:
Import the REST APIs using Web Services import editor, as shown below
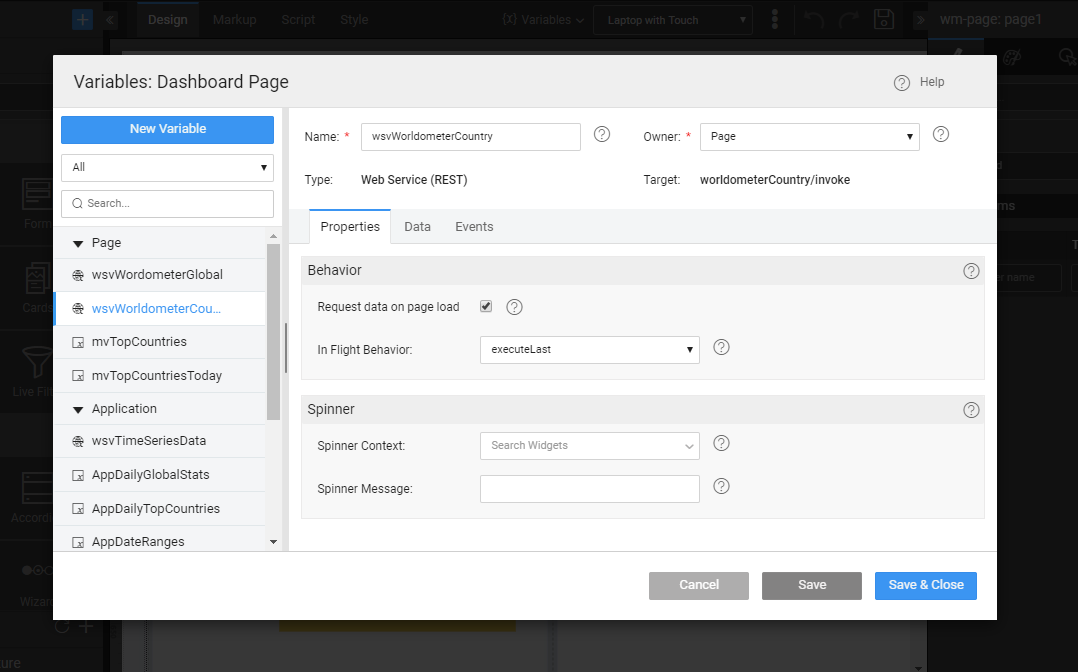
Step 2: Create Variable to access REST API
Create a Page for the dashboard, and create a Variable within this page for the imported REST API, which enables invocation of the API whenever the page is accessed.
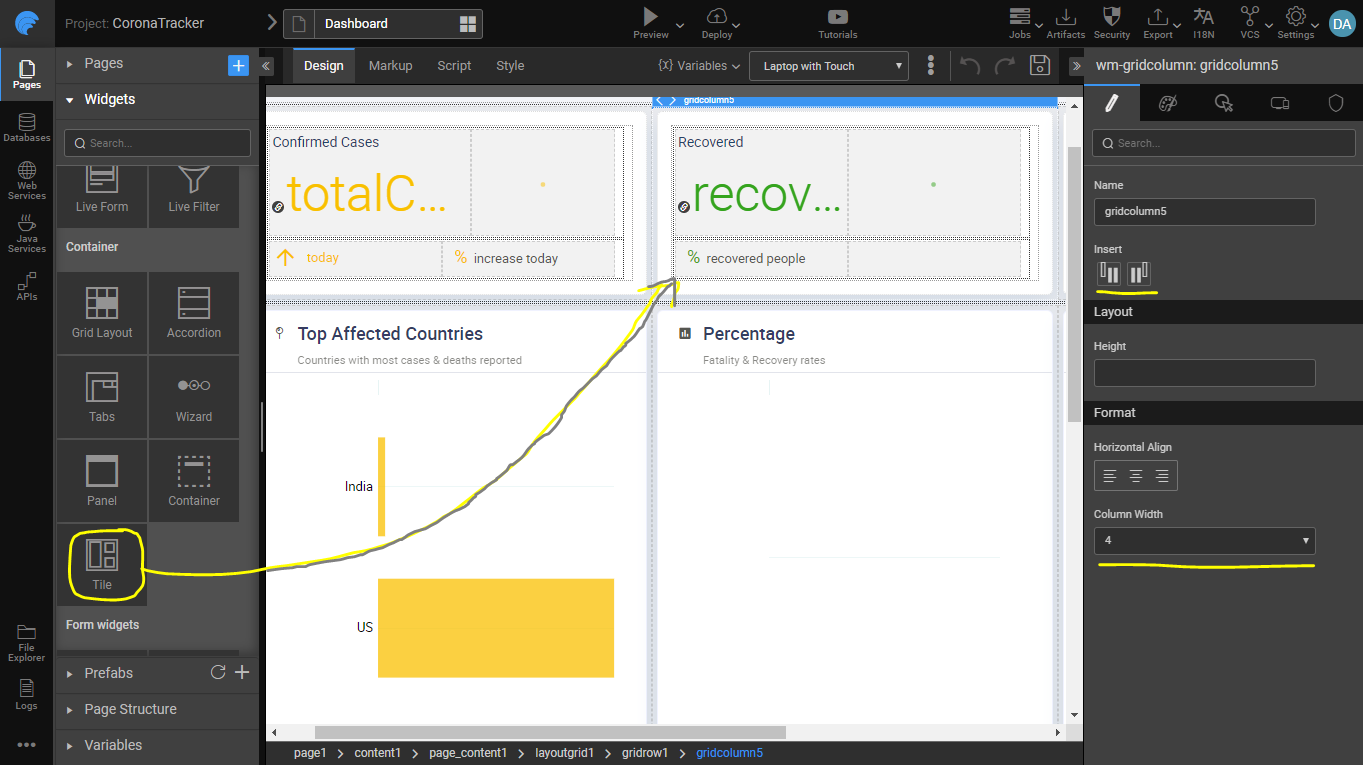
Step 3: Drag-n-drop widgets on to Canvas
Key metrics for confirmed cases, recovery & deaths are built as tiles as shown. Each tile is further divided into sections using a Grid Layout which can be further customized to represent the data. Grid Layout is used to define the arrangement of various widgets on the page, by dividing the page into several responsive blocks. The size of each block can be configured and new columns and rows can be inserted as needed.
Step 4: Bind widgets to the Variable for data
After arranging the widgets on the canvas, we can bind data to these widgets from the created variable using the Properties panel. WaveMaker automatically identifies the JSON response structure from the imported REST API and makes it available for binding through variables.
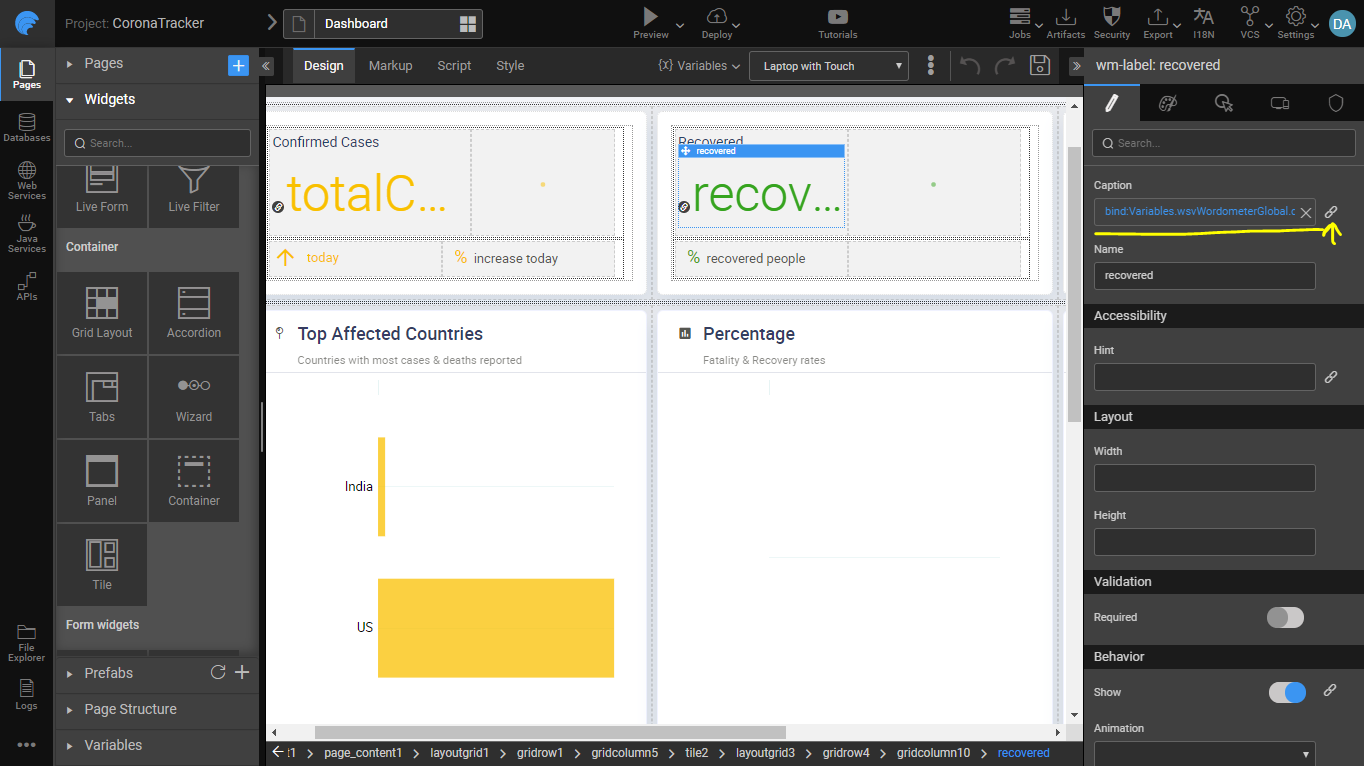
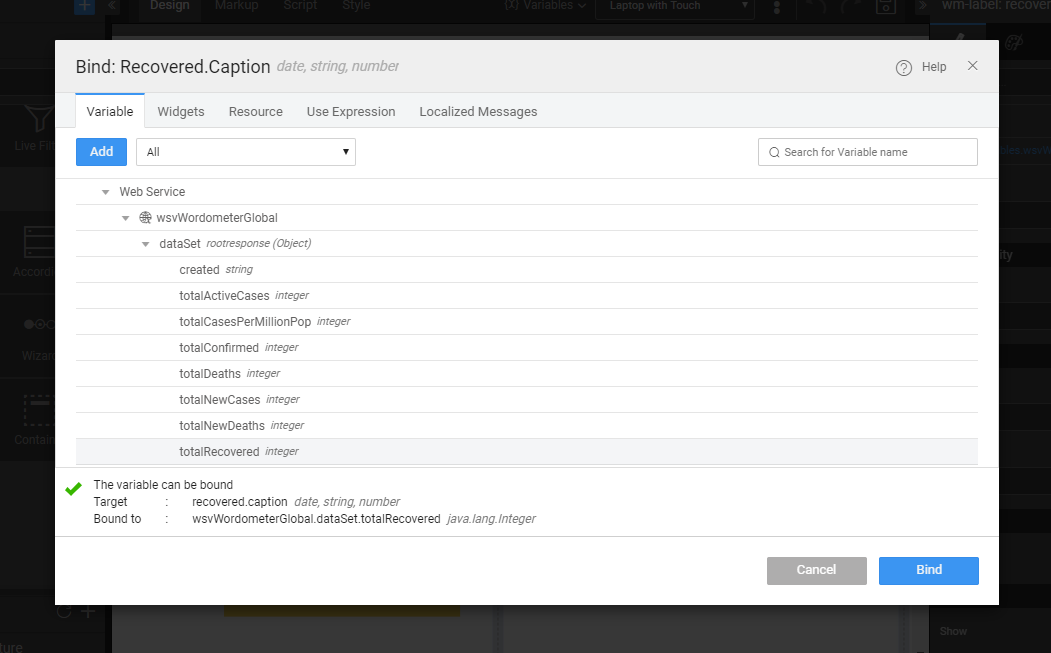
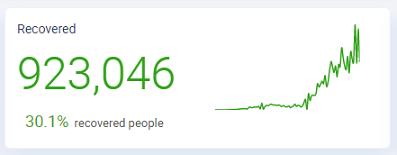
Bingo! We have the metrics from the REST API in our dashboard page.
Wait!, how did we get the other metric for % of recovered people?
Apart from just binding the data to API response, WaveMaker enables writing simple expressions as shown below to compute data. f(n) = (totalRecovered * 100) / totalConfirmed gives the % recovery, alongside using other data formatting rules.

Step 5: Deploy to the cloud and we are done!
For more information, see how to deploy an app with One-Click Deployment.
What's next?
In the next series of the blog post for developing a Covid-19 visualization using WaveMaker, see how to build visualization for charts and visualization for maps.