Integrating Crashlytics
Crashlytics is a crash reporting and analysis tool provided by Firebase. Crashlytics helps developers track and understand crashes that occur in their mobile applications. It provides insights into the causes of crashes and allows developers to take action to improve the stability of their apps, which essentially contributes to higher user satisfaction and increased app success.
Using Firebase Crashlytics For Crash Reporting
To send crash logs to Crashlytics, you need to integrate the Crashlytics SDK into your WaveMaker application's codebase. If you don't have a Firebase project, create one on the Firebase Console: console.firebase.google.com Once you have created a Firebase project, you can follow the steps below to integrate Crashlytics into a WaveMaker application.
Adding Crashlytics Plugin to WaveMaker App
Crashlytics plugins can be installed in a few steps in a WaveMaker application. Please refer to this page
on how to install the plugin. Also, install the following npm packages in your WaveMaker application:
- react-native-firebase/app
- react-native-firebase/crashlytics
Please refer to this page on how to install npm packages to your WaveMaker application.
Once installed, create firebase folder under src/main/webapp/resources and upload google-services.json file to the src/main/webapp/resources/firebase in a WaveMaker application.
Also, create app.json file and add the following config plugin and add google-services.json file path to your app.json and upload that app.json to src/main/webapp in a WaveMaker application.
app.json
Create Firebase JSON in the App
Create firebase.json file in the root directory of your WaveMaker application with the Crashlytics-related keys set to the following values:
firebase.json
In case of any crash in your WaveMaker application the above configuration would ensure that the crash logs are sent to Crashlytics.
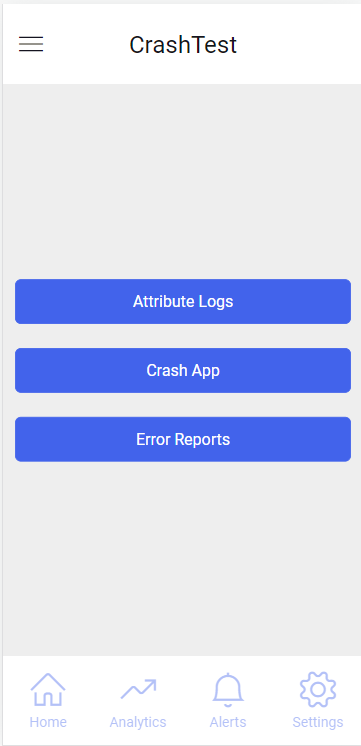
You can also check Crashlytics set-up by invoking in-built test function crash() in your application as follows.
In addition to crash reporting you can also use the Crashlytics SDK to log custom messages, events, and errors.
Crashlytics Interfaces
Crashlytics provides the following interfaces to log messages, events, and errors.
| Methods | Description |
|---|---|
| log(message: String) | Log a custom message or event |
| logException(exception: Throwable) | Logs an exception or error that occurred in the app. |
| recordError(error: Throwable) | Records an error without causing the app to crash. |
| setAttribute(key: String, value: Any) | Sets a custom key-value attribute that provides additional context for crash reports. |
| setUserId(userId: String) | Associates a user identifier with crash reports, helping to identify affected users. |
| catchException(exception: Throwable) | Catches an exception to provide more context about app issues. |
Crash Logs Attributes and Error Reports
You can use methods to set attributes for the crash report, which enables analytic data when crash occurs. This helps you review them. In addition, you can report errors to Crashlytics using the recordError when you catch unexpected errors.
The following is the code snippet for the above mockup:
To view crash reports in Firebase Crashlytics
Log In to Firebase Console
- Open your web browser and go to the Firebase Console: console.firebase.google.com
- Log in using the Google account associated with your Firebase project.
Select Your Project
- If you have multiple projects, select the appropriate project from the Firebase project list.
Navigate to Crashlytics
- In the left-hand menu, you should see a list of available Firebase services. Scroll down and click on "Crashlytics."
View Crash Reports
- Once you're in the Crashlytics section, you'll see a dashboard displaying a summary of crash reports and issues detected in your app.
- The dashboard will show a list of recent crashes, with information such as the number of affected users, the issue's impact, and a brief description of the error.
Crashlytics is yet to have intelligence to map crash with the page in application. In order to map the crash with the page, you can add the page name as a custom attribute to the crash report.
Like, crashlytics().setAttribute("page", "page-name") in the onReady function of the page.
In Crashlytics we can visualize various crash reports in the form of charts, graphs and tables. The following are the few examples of crash reports.
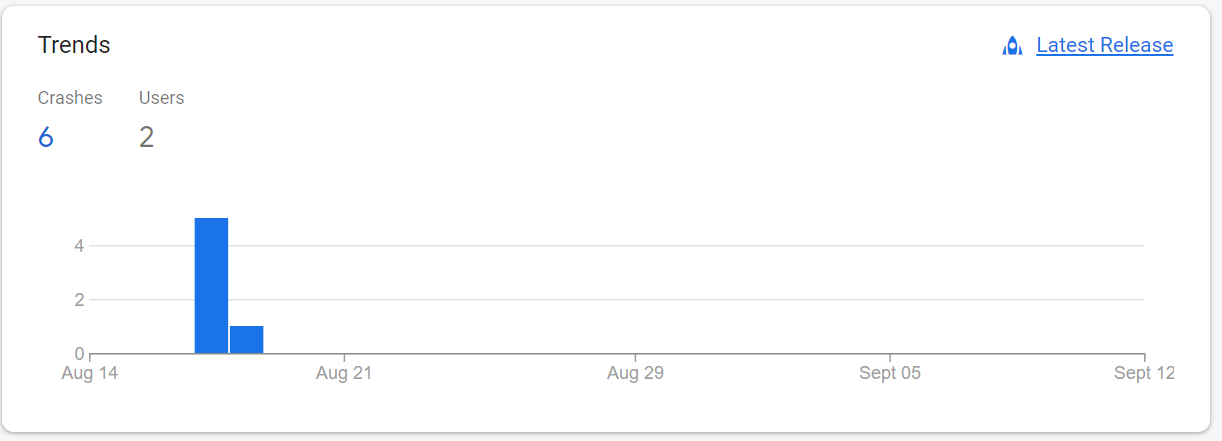
Crash Trends
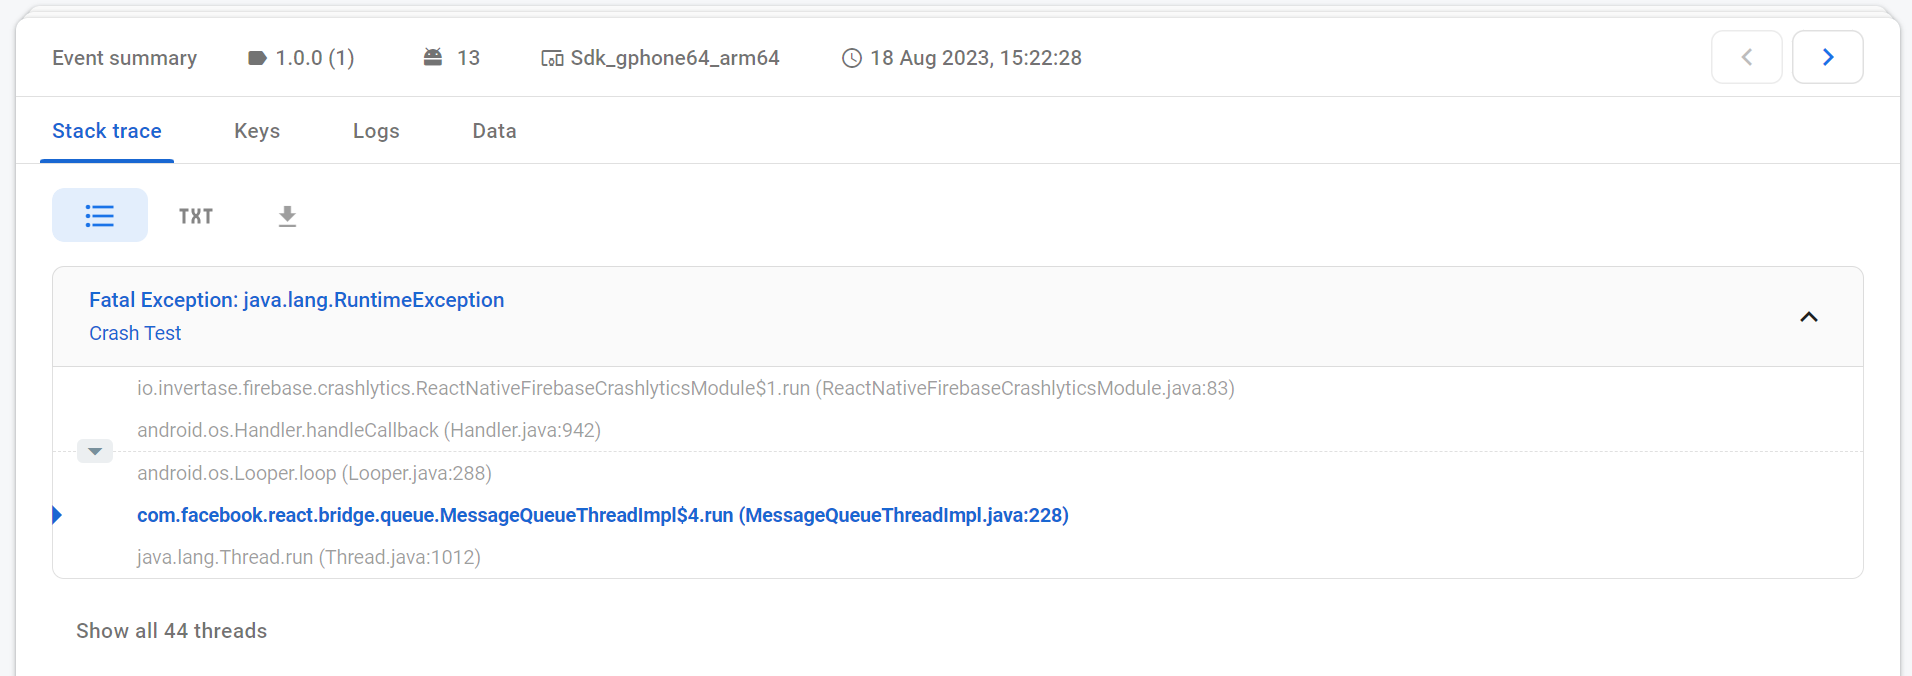
Crash Event Summary
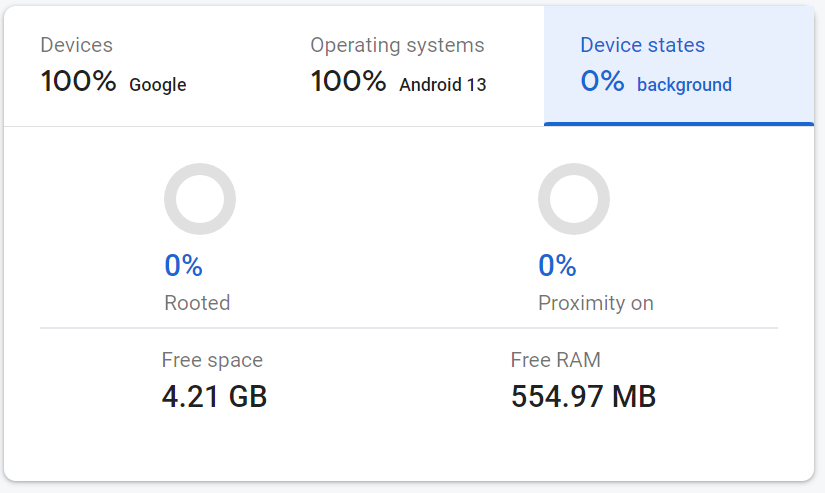
Crash Device Status