Integrating Sentry
Sentry is a popular error and crash reporting tool that helps developers monitor and diagnose issues in their applications. It provides real-time error tracking, alerting, and issue resolution features. By tracking errors and providing insights into their causes, Sentry enables developers to improve the stability and reliability of their applications.
Using Sentry For Crash Reporting
To send crash logs to Sentry, you will need to integrate the Sentry SDK into your WaveMaker application. If you don't have Sentry project, create project on the Sentry. Sentry offers both free and paid plans with different levels of features and support. Once you created project in sentry, you will get DSN (Data Source Name).
DSN is a unique identifier for your project and is used to send error data to Sentry. You can find your project's DSN in your project's Settings > Projects > Project name > Client Keys (DSN) tab.
Now, you can follow the steps below to integrate Sentry into a WaveMaker application.
Adding Expo Sentry Plugin to your WaveMaker App
- sentry-expo
Sentry plugins can be installed in a few steps in a WaveMaker application. Please refer to this page on how to install the plugin.
Once installed, create app.json file and add the following config plugin and upload that app.json to src/main/webapp in a WaveMaker application.
app.json
Crash Logs and Error Reports
You can use sentry methods to capture errors, exceptions, and crashes that occur in your application. This includes unhandled exceptions and crashes, as well as any custom errors or messages you choose to log.
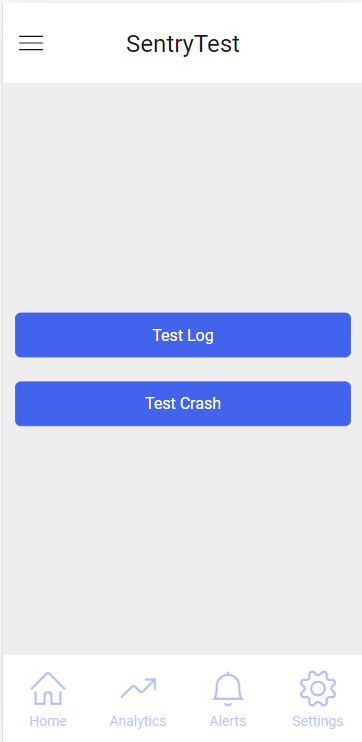
The following is the code snippet for the above mockup:
To view crash reports in Sentry
Log In to Sentry
Navigate to projects
- In the left-hand menu, you can see
Projectstab. Click on it.
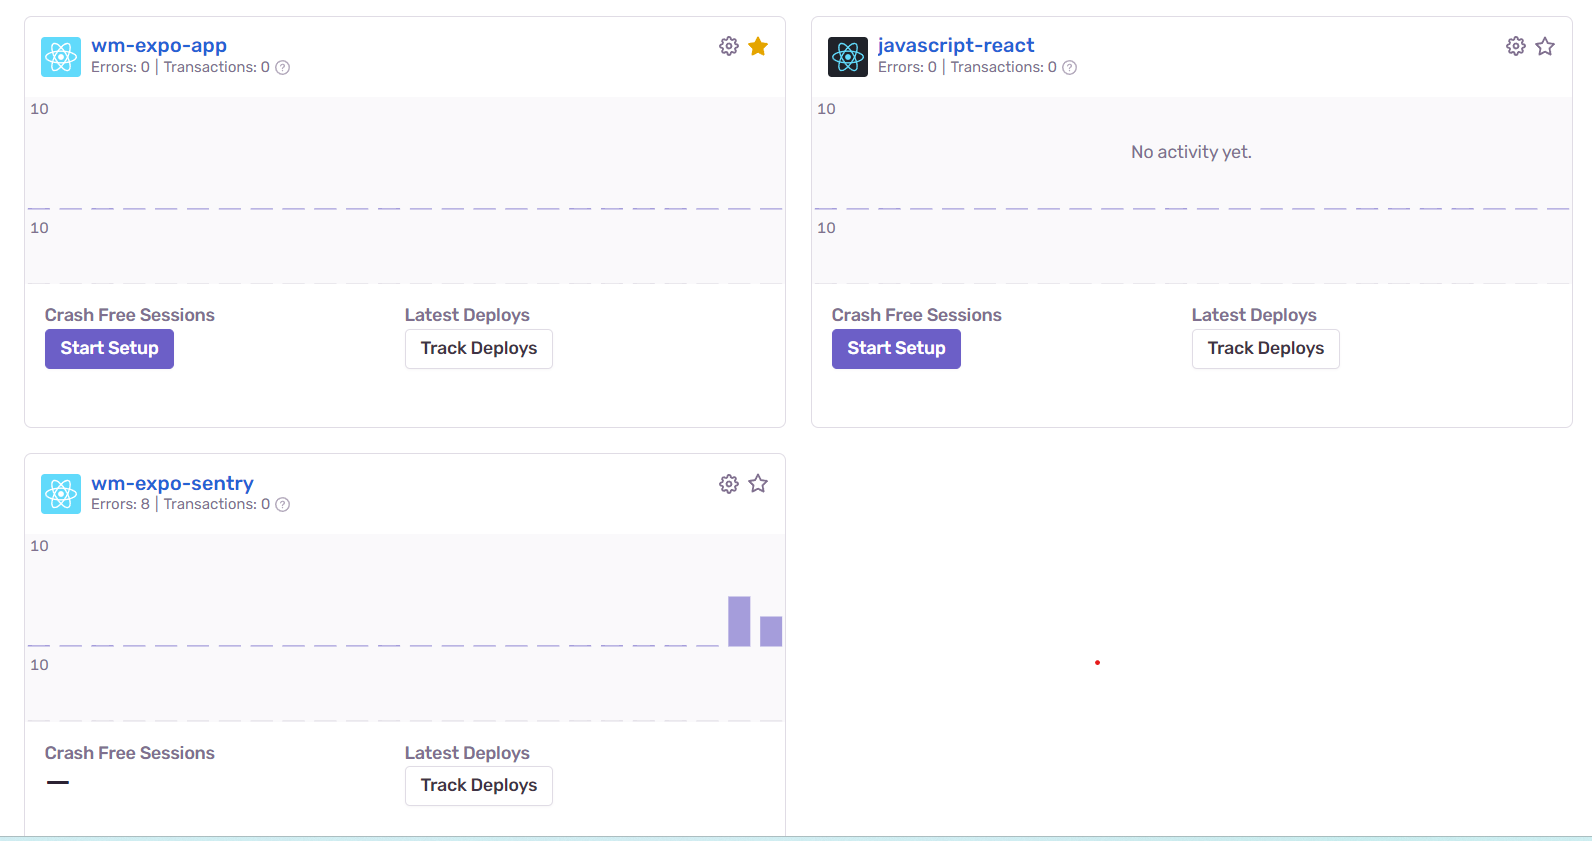
Select Your Project
- If you have multiple projects, select the appropriate project from the project list.
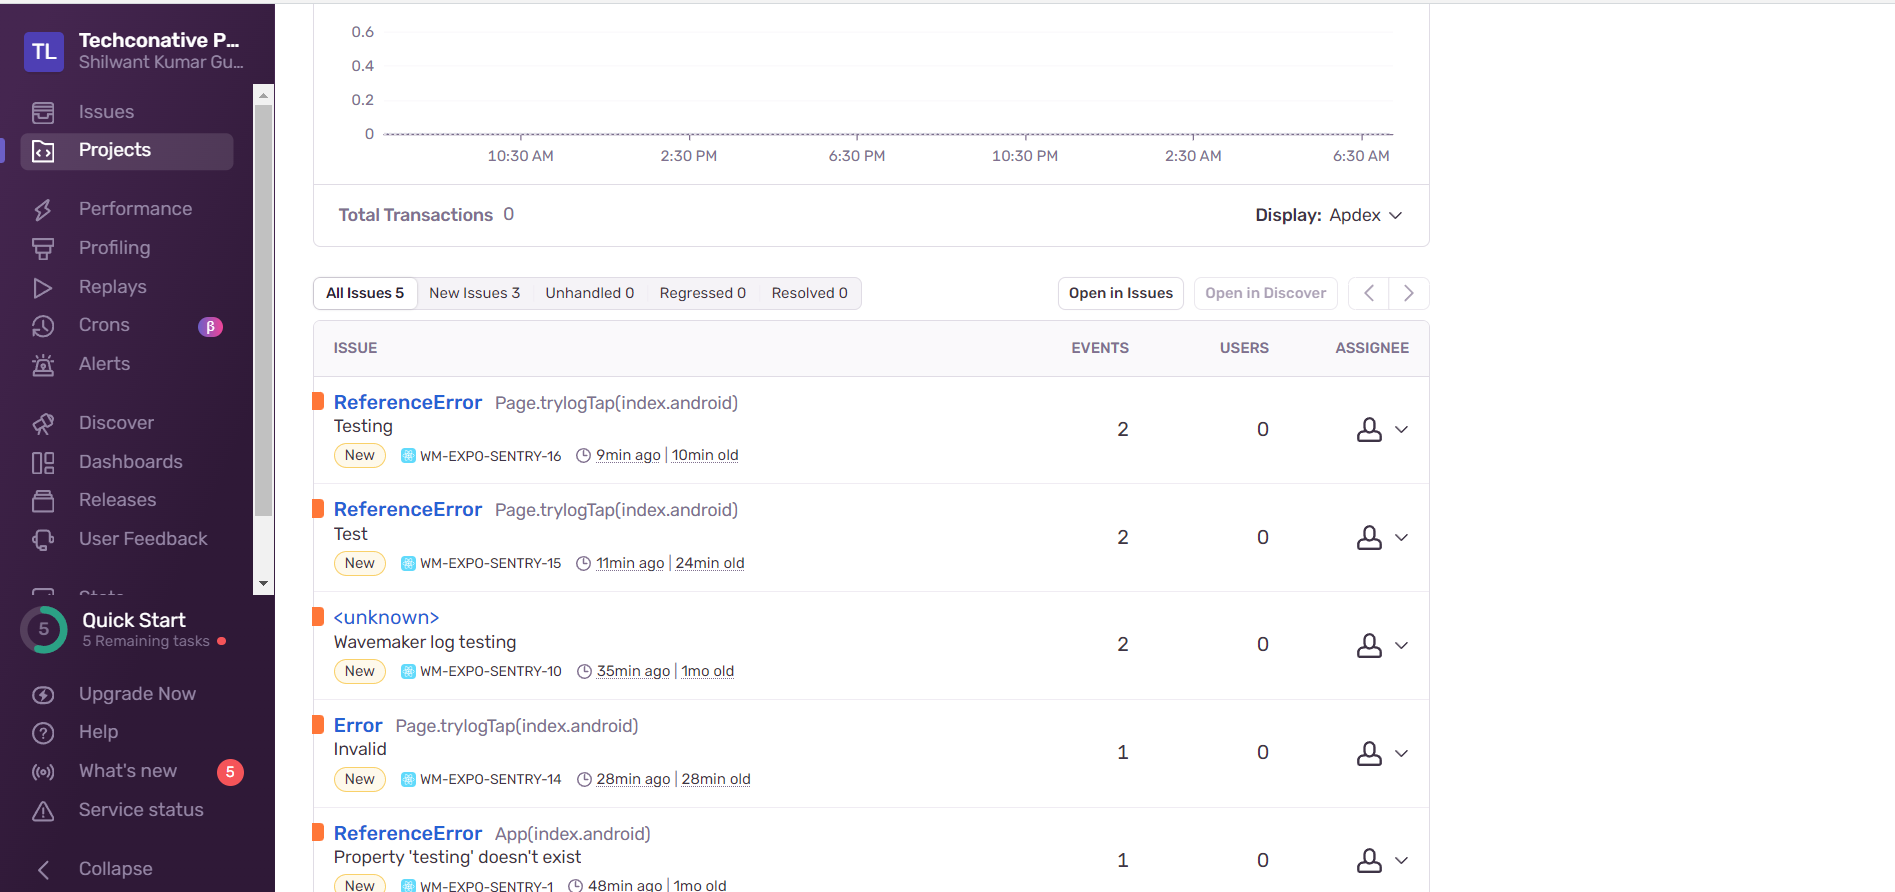
View reports
- Once you selected appropriate project, you can see captured errors, exceptions, and crash reports.